

1.1 Overview
The Internal Assessment (IA) is your opportunity to apply economic theory to real-world events, demonstrating your analytical skills through an economist’s lens. You’ll select articles and evaluate the relevant economic themes across Microeconomics, Macroeconomics, and The Global Economy units. Together, these three commentaries contribute 20% of your final grade. While each commentary is only 800 words, writing all three over the span of nearly a year can feel like a lengthy, ongoing process—so stay organized and on track!
Individual Work
You are responsible for selecting your own articles and preparing each commentary independently. While others may choose the same article, the work you produce must be your own and not collaboratively prepared.
Focus of Each Commentary
Each commentary must:
•
Link the article to relevant economic theory from the syllabus section it covers.
•
Show economic insights, demonstrating your ability to discuss the implications of the event as an economist.
1.2 Assessment Criteria for the IA
The IA is a significant part of your final grade, so approach it seriously. Many students fall short despite having ample time. Be clear on what a high-quality IA looks like, there’s no reason not to aim for a 6 or 7!
Criterion A: Diagrams
•
Provide 2 relevant, labeled diagrams: Ensure each diagram directly relates to the article and is clearly labeled.
•
Explain shifts and impacts: Clearly describe how and why the curves shift and their effects on price, production, and other key variables.
Level | Descriptor |
3 | Relevant, accurate and correctly labeled diagrams are included, with a full explanation |
Criterion C: Application and Analysis
Apply economic theory to the article, analyzing the effects on stakeholders and suggesting countermeasures.
Level | Descriptor |
2 | Relevant economic concepts and/or theories are applied to the article appropriately throughout the commentary. |
Criterion D: Key Concepts
Link your commentary to a key concept (WISE ChoICES Concepts). Introduce it at the beginning and reference it throughout.
Level | Descriptor |
3 | There is effective economic analysis relating to the article. |
Criterion E: Evaluation
•
Assess the situation and solutions: Provide clear, well-reasoned arguments to evaluate the issue effectively.
•
Include comparisons and counterarguments: Strengthen your reasoning by contrasting alternatives and addressing opposing views.
Level | Descriptor |
4 | Judgments are made that are supported by effective and balanced reasoning. |
Criterion F: Rubric Requirements
•
Each article is based on a different syllabus unit.
•
Each article is from a unique, reliable source.
•
Articles are published within one year of writing.
•
Don’t overlook the final portfolio criterion, as those extra 3 marks can make a significant difference in your overall grade.
Level | Descriptor |
3 | All five rubric requirements are met |
Grade conversion
The IA portfolio is scored out of 45 marks:
•
14 marks per commentary (3 commentaries) = 42 marks (no worries if you screw up the first one, you’ve got a second chance to make up!)
•
3 additional marks from the F criterion for the overall portfolio
The total score determines your IB grade on the 1-7 scale as follows:
IB Grade Level | Total Marks (out of 45) |
Level 1 | 0-6 |
Level 2 | 7-12 |
Level 3 | 13-20 |
Level 4 | 21-25 |
Level 5 | 26-31 |
Level 6 | 32-36 |
Level 7 | 37-45 |
Don’t worry if one of your IA commentaries scores lower than expected. The final IA grade is based on the combined score of all three commentaries. If you perform well in the remaining two, you can still achieve a higher overall grade. A lower score in Microeconomics can be offset by strong scores in Macroeconomics and The Global Economy or vice versa.
1.3 Structure and Word Count Guidelines
#Advice: This should be on the first page of your IA Commentary
For each commentary, include:
•
Title of the article
•
Source (including access date if online)
•
Publication date of the article
•
Date of your commentary
•
Word count
•
Syllabus section related to the article
•
Key Concept (WISE ChoICES concept)
#Advice: The maximum word count for your Economics IA is 800 words. Aim for quality, not quantity.
Section | Purpose |
Introduction 75 words | Briefly summarize the article and define key terms only when relevant. |
Overview (≈ Identify the Problem) 100 Words | Explain the core issue, e.g., how sugary drinks cause market failure through negative externalities, and a diagram that illustrates this. |
Analysis (≈ Explain the Proposed Policy)
200 - 250 Words | Describe the policy's aim, like how a soda tax shifts the supply curve to reduce consumption of a harmful good. |
Evaluate Unintended Effects
250 - 300 Words | Analyze possible side effects. A strong evaluation is crucial here. |
Conclusion
75 Words | Recap the policy's purpose, intended impact, and your evaluation without adding new points. |
#Advice: Diagrams, Equations, formulae, and calculations, and References (included in footnotes or endnotes) does not count toward the 800 word llimit
Example
Intro
This article examines the implementation of a specific tax, a type of indirect tax fixed per unit of produce, on sugary drinks in the United Kingdom. Sugary drinks are an example of demerit goods, which are “considered to be undesirable for consumers.” The market for demerit goods represents market failure, defined as “a situation in which the market mechanism fails to allocate resources efficiently.” The tax aims to address this inefficiency by improving welfare, as it seeks to reduce overconsumption, alleviate health-related societal costs, and promote better resource allocation for long-run public benefit.
Overview
The market for sugary drinks fails given the presence of negative externalities of consumption, where the “actions of consumers give rise to negative side-effects on other people who aren’t part of these actions” . The main negative externality of consumption is the amount of money that the healthcare industry spends on sugary drink consumers due to their “increased risk of developing obesity, heart disease, and dental problems” . Obesity alone costs the NHS approximately “£5.1 billion per year” , illustrating the extent of this negative externality.
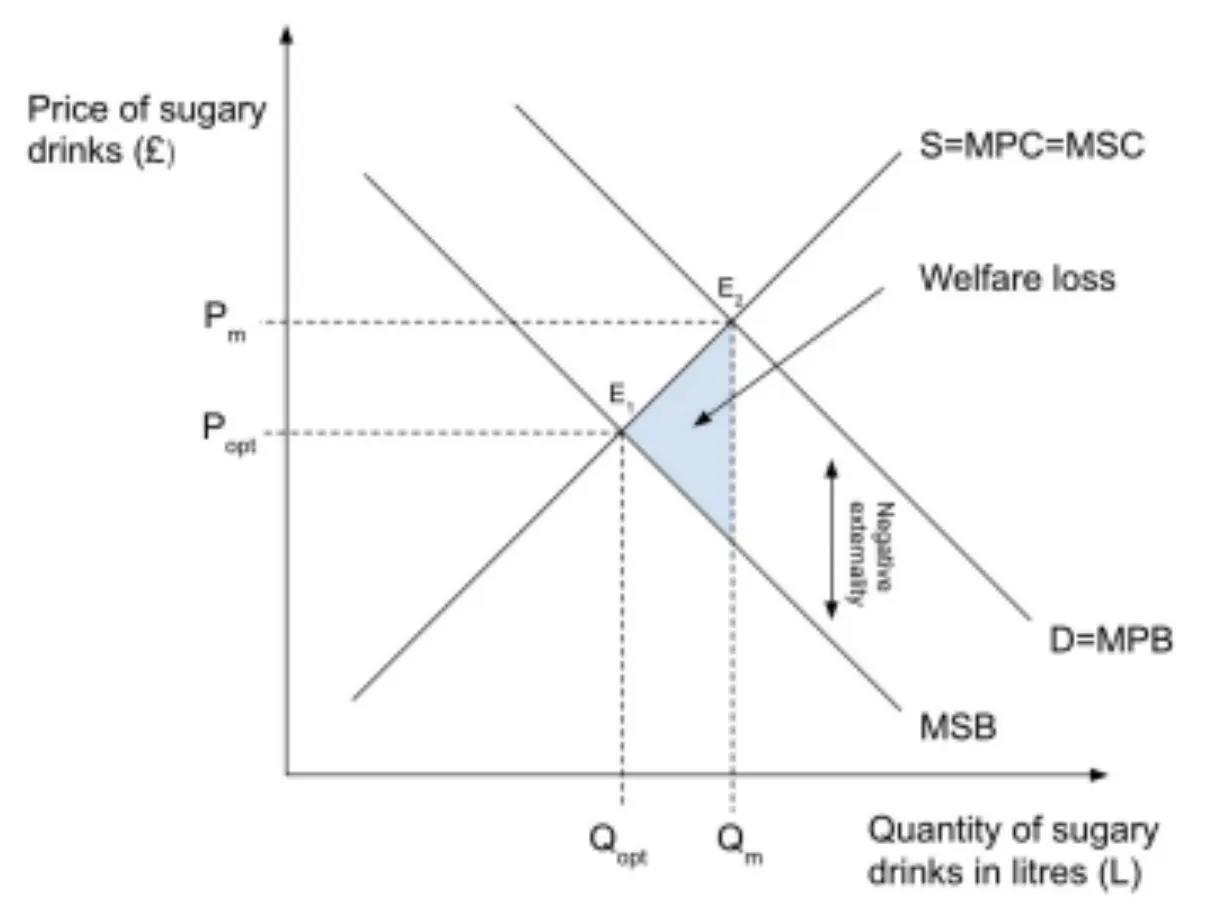
Figure 1.3.1 Market for sugary drinks
Analysis
Diagram 1 illustrates how the market for sugary drinks fails. The socially optimal equilibrium - where resources would be allocated most efficiently - is at E1, where marginal social benefits (MSB) = marginal social costs (MSC). However, the market for sugary drinks operates at the free-market equilibrium E2, where the private benefits of consumers are maximised and marginal private benefits (MPB) = marginal private cost (MPC). This results in market failure since sugary drinks are over consumed (Qm > Qopt), leading to a welfare loss. Therefore, government intervention such as taxation is necessary.
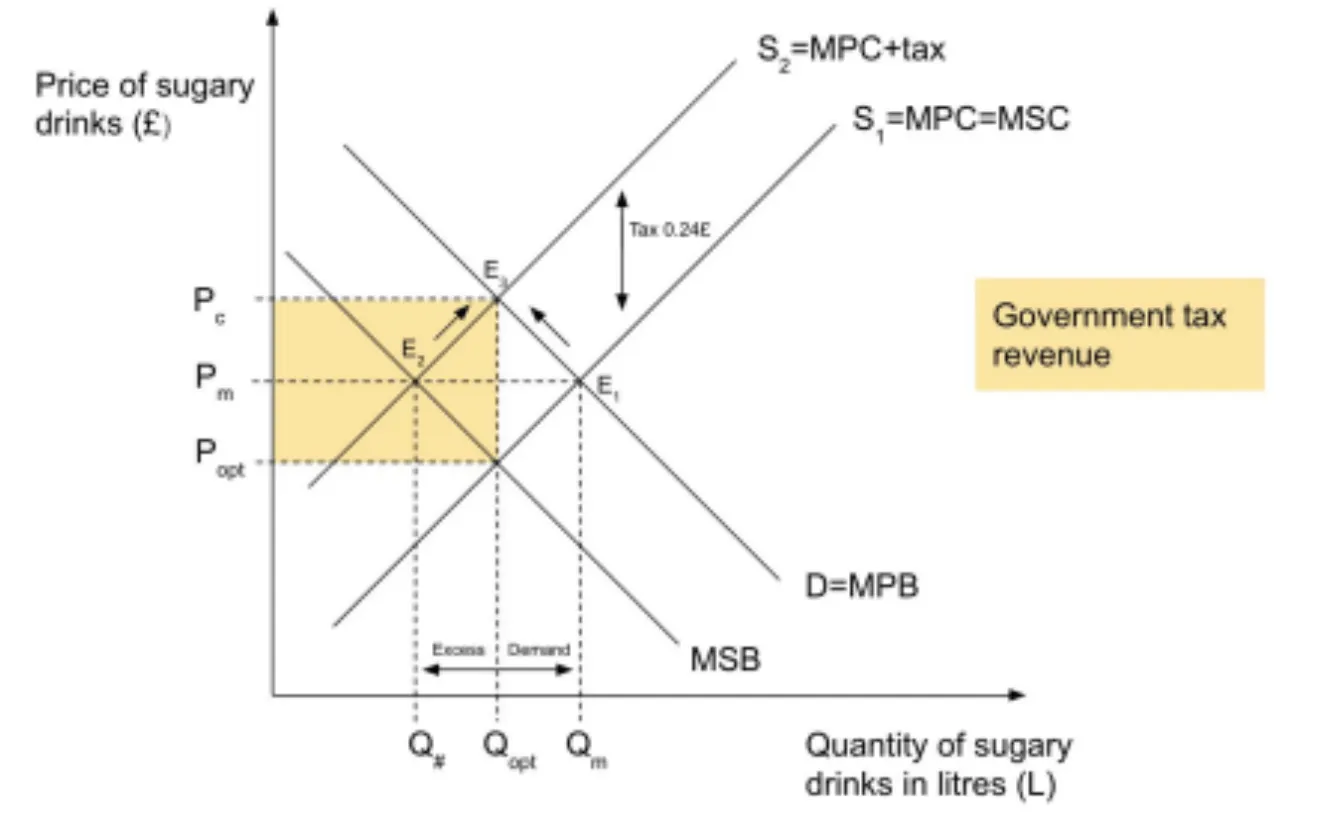
Figure 1.3.2 Market for sugary drinks with more than 8 grams pf sugar per 100ml
The article outlines two bands of the sugar tax; one for “drinks containing 5-8 grams of sugar per 100ml, which will add 0.18£ per litre”, and another for “drinks containing more than 8 grams of sugar per 100ml, which will add 0.24£ per litre”. Diagram 2 illustrates the effects of implementing the higher band of the sugar tax; 0.24£ per litre. The original free-market equilibrium is at E1 yet, after the implementation of the tax, the supply curve shifts upwards to S2 by the value of the tax. At this point, E2, producers will only be willing and able to supply at Q# at the price Pm. This results in excess demand. Ultimately, market forces will cause supply and demand to move to the new equilibrium E3 at higher price Pc and lower quantity demanded Qopt. By decreasing the quantity demanded the tax will, in theory, lead to the internalization of the negative externality and reduce the welfare loss in the sugary drink market.
A benefit of the sugar tax is that it incentivizes producers to reduce the sugar content of their drinks. Producers are profit-driven and would want to produce goods that are in the lower band of the sugar tax, as was the case in the UK where “50% of manufacturers have reduced the sugar content of their drinks”. Decreasing the sugar content reduces the health risks for sugar consumers, thereby reducing the negative externality.
The sugar tax also raises government tax revenue, as seen in Diagram 2, which is estimated to be “£240m a year which, in England, will be invested in merit goods such as school sports and breakfast clubs”. This shows that, even if the tax is unsuccessful at reducing sugary drink consumption, it will help promote a healthy lifestyle that will reduce the health risks and negative externalities of sugary drink consumption.
Evaluation
The sugar tax also has some disadvantages. Firstly, it causes producer revenue to fall from Pm×Qmto Popt×Qopt, making producers worse off after the tax. This could not only cause opposition from producers, but could also lead to structural unemployment. After the tax, fewer goods are produced (Qopt < Qm), hence less workers will be needed to produce them. These workers are mostly low-skilled manufacturing workers which, if fired, will not have the skillset to find a new job and will be worse off after the tax.
Furthermore, indirect taxes are regressive and thus increase income inequality. Indirect taxes are fixed on expenditure, meaning that all consumers pay the same amount of tax (in this case, 0.24£ per litre). This means that high-income consumers pay a lower percentage of their income on the tax in comparison to low-income consumers, which is an unfair burden to put on low-income consumers.
Conclusion
Despite its advantages, it’s clear that the sugar tax won’t fully maximize welfare in the sugary drink market due to its regressive nature and varied effects on stakeholders. To better enhance societal welfare, additional government interventions, such as negative advertising, might be necessary to more effectively internalize the negative externalities of sugary drink consumption.