

Modeling and Optimization into different factors of the safety nets to minimize the casualties from a falling brick from a construction site.
1. Introduction
These days, skyscrapers are mostly built in cities for various purposes. However, there are possible dangers of freefalling bricks or metal materials that cause serious damage to workers and even passers-by. A normal force that does the slightest damage in the human head is 84 grams, but considering the weight a normal construction brick,2.04 kg(CivilSir, 2023), the brick itself is a deadly weapon for the passengers below. Therefore, to prevent casualties, safety nets are implemented in building walls in countries such as Singapore, England and Japan. Yet in Vietnam safety nets are not mandatory, domestic construction firms purposely exclude the safety nets to save money. This fails to assure the safety of the peasants and workers themselves.
After secondary research, I discovered how vulnerable the construction fields in Vietnam are, since it could not assure the safety of the workers and the passengers compared to other nations that implement nets, even sold in the internet widely, while this is not a common item that is found explicitly in Vietnam. Therefore, my IA focuses on dealing with the issue of safety. I will think of possible dimensions, angles, thickness and material for safety nets so that this could prevent hazardous issues in the future. In order to understand where the brick fell, I found a construction site with an unfinished building, which could increase the credibility of my result rather than scaling down the experiment. After the experiment, my plan is to find the dimension that has high efficiency by plotting a reference point on the position where the brick fell and draw a normal distribution model to find out the range of the distance where it has the highest percentage.
After acquiring the dimension, my IA will extend by taking into consideration conditional situations such as the brick penetrating through the barrier or bouncing off. Inorder to prevent this, I will use an theoretical model by calculating the impulse of the brick when first hitting the barrier and apply the “V” Safety net to check if the net could absorb the energy.
My aim for this math IA experiment is to model and optimize different factors of the safety nets to minimize the casualties from a falling brick from a construction site.
 A+ aim and rational given. Introduction given.
Criterion C: 1 out of 3 version
Criterion C: 2 out of 3 version
Criterion C: 3 out of 3 version
2. Finding the most probable location of brick fall
To estimate the dimension of the safety nets, it is important to consider the most probable position of where the brick could fall. To do so, I decided to visit an unfinished construction site and conduct an experiment by dropping the brick from the 30th floor and recording the coordinates of the position they were dropped at. To avoid any possible safety hazard in this experiment, I ensured that no other people were inside the construction site during my experiment and received permission from the officials to enter the construction site. Since many of the modern skyscrapers have at least 30 stories, With permission, I decided to set the height as 30th floor(105m) and that the safety nets should be able to cover the damage from such high height to ensure the safety in most of the scenarios. This indicates that the 30th floor fits regarding estimating how bricks would fall for other conditions as well, even with higher buildings.
However, to model the falling brick and estimate different factors of the safety nets, it was important to consider all different real-life factors that could affect the falling brick, such as the wind, before conducting any calculations. To justify the model, below were some assumptions I have made about several variables that could affect the result of my experiment.
Control Variables
I. Wind
•
In this investigation, the wind will not be considered when modeling the falling object. In our research, the wind will mostly by negligible in their effect to the falling construction brick due to its mass and rigidness. However, as there could be an inevitable effect in the case of strong winds, in our model, a specific range will be set during the experiment to minimize the influence of the wind on the result.
•
As our experiment was conducted outside, to ensure my control of this variable, I conducted my experiment in dry, sunny weather, and utilized a mini anemometer to measure the wind speed before the experiment to check if the wind was powerful enough to affect the brick during its freefall. If the wind was above 5ms-1, I did not conduct any experiment on that day.
II. Weight of the brick
•
From my research, the average brick weighed between 1.95kg and 2.04kg. Therefore, for consistency in our results, I utilized different bricks that weighed approximately 2 ± 0.1 kg, which is a rounded average between 1.95 and 2.04.
III. The dropping position
•
To make sure the brick is being dropped from rest and from a constant position, I dropped the brick 30cm apart from the handrail. This was checked during the ruler in every trial
3. Data
To calculate the location of the brick fall, I used the (𝑥, 𝑦) coordinate system to represent the
distance of the brick from the reference point (0, 0) after their freefall. Then, as per the
central limit theorem which states that taking sufficiently large random samples (≥ 30) from
the population will allow the distribution of the sample means to approximately follow a
normal distribution, I decided to conduct at least 40 trials to make sure I can estimate my
result as a normal distribution.
After conducting my experiment, I have calculated the mean and the standard deviation for my raw data using excel. However, to filter out possible anomalies, I have conducted a Z-test with all my raw data to use only the justified data points in my scatter plot.
Please refer to figure 1 for the coordinate and the reference point I have utilized.
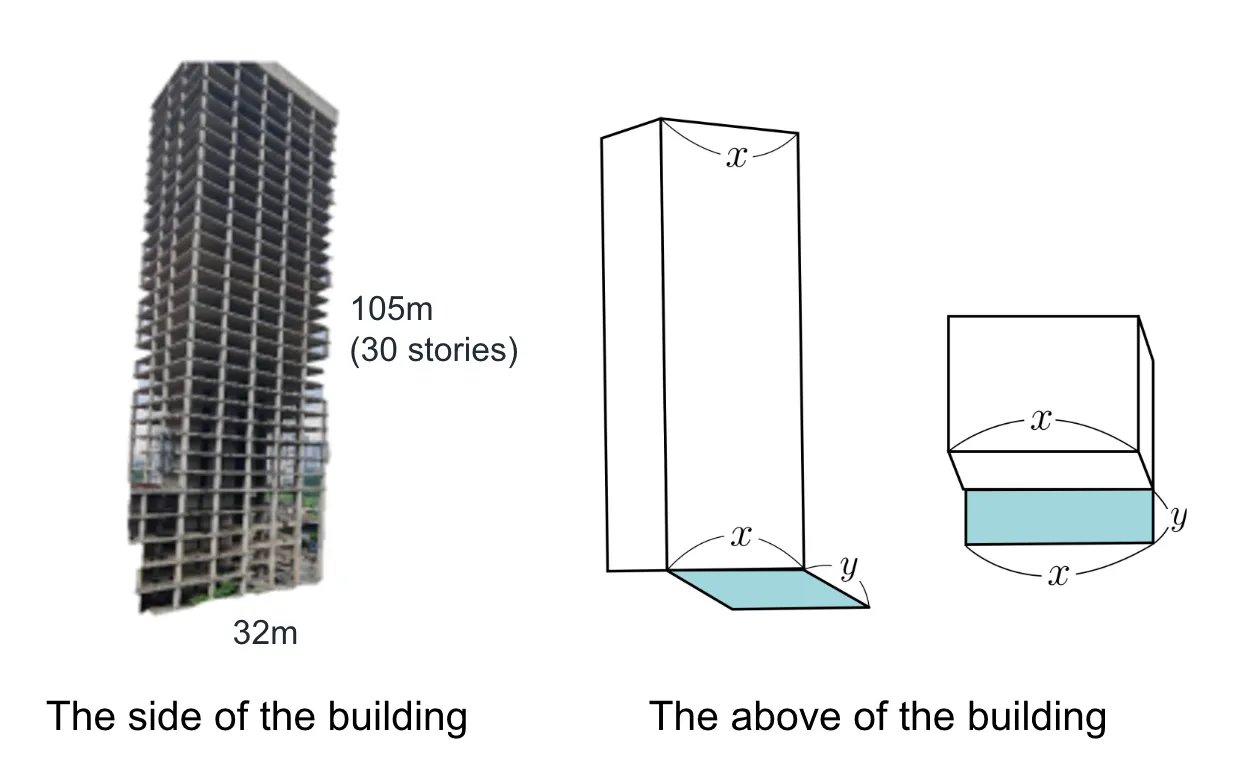
Figure 1: x-y plot from the building
The methodology of obtaining the coordinate for brick fall is explained. The student has annotated the diagrams to give context to real-life scenarios, which would reward this presentation a 3 out of 4 in Criterion A.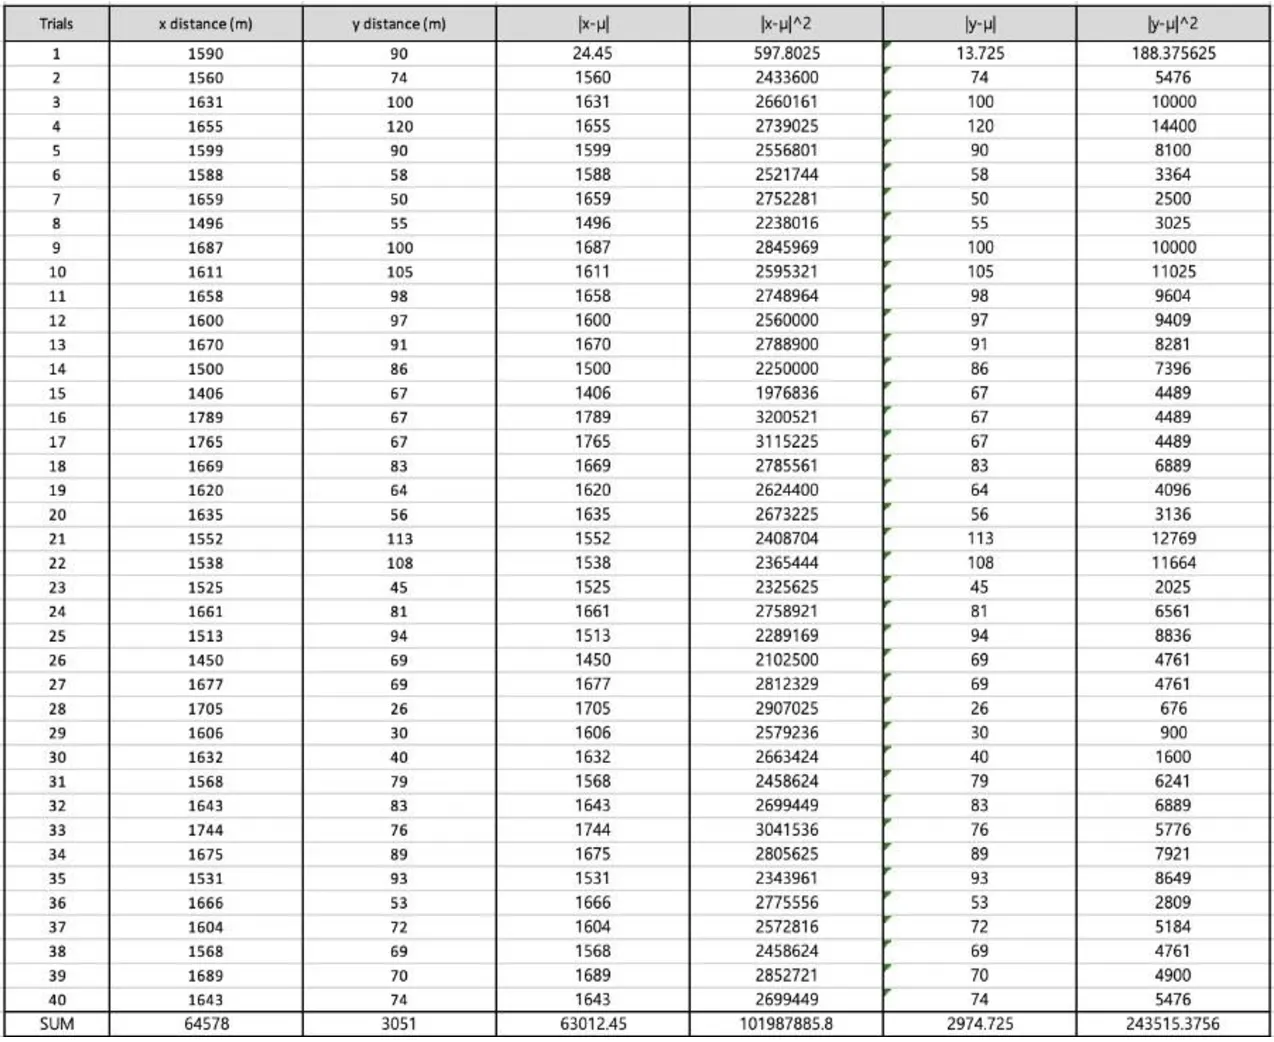
Figure 2. Table of processed data providing information about the location of the brick through an x-y coordinate
Criterion A: 2 out of 4This extensive data sets should be placed in the appendices to keep the main analysis concise and readable. Allow the reader to refer to the data if needed without interrupting the flow of the report.
Criterion B: 2 out of 4There is an inconsistency in rounding and decimal places. Data should be rounded to appropriate degree of accuracy and the student should explain why such degree of precision was chosen.
Criterion A: 3 out of 4 version
Criterion A: 4 out of 4 version
Firstly, and 𝑦 value is crucial in my finding, the vertical distance the brick fell should all
be summed up. To find the mean, all the different x and y values have been added together and divided by 40, which gives the mean distance.
Mean of x:
64578 ÷ 40 = 1614. 45
≈ 1615
Criterion B: 2 out of 4There is an inconsistency in rounding and decimal places. Data should be rounded to appropriate degree of accuracy and the student should explain why such degree of precision was chosen.
Mean of y:
3051 ÷ 40 = 76. 275
≈ 76. 3
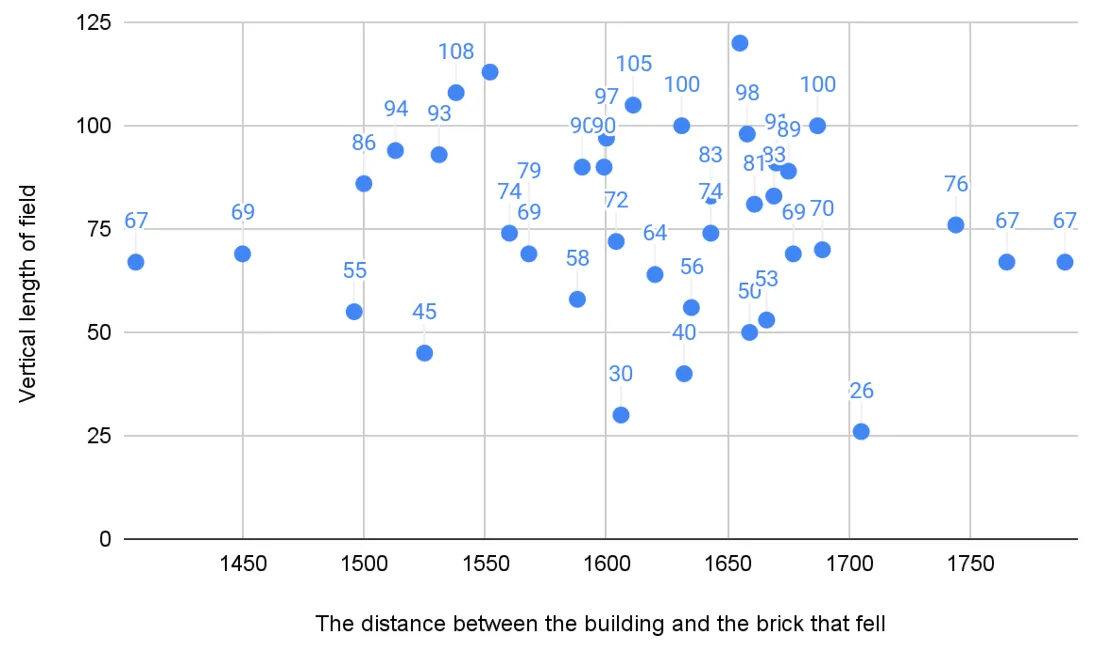
Figure 3. Table of processed data providing information about the location of the brick through a Scatter plot
The context for obtaining this scatter plot is explained above. Though each axis is labeled, the unit for each axis is still missing. Hence, this presentation would get 3 out of 4 in Criterion A.Criterion A - To get 4 out of 4 in presentation…
4. Z-Modified Test
Before calculating the most probable location of the brick fall, it is important to filter out the possible anomalies in our raw data. To find out the outlier, to find specific data, I have conducted the modified Z-test to utilize only the justified data points in my scatter plot.
Usually, when the mean (µ) and the standard deviation (σ) are known, we can use the
to filter out the anomalies. The 𝑧 − 𝑠𝑐𝑜𝑟𝑒 measures the relative distance
between the data point and its mean, and large absolute values of 𝑧 − 𝑠𝑐𝑜𝑟𝑒 suggests an
anomaly. (Jim, 2023) However, since the mean and the standard deviation are themselves susceptible to the presence of anomalies, given such a small sample size from my experiment, I decided to use more reliable statistical analysis from my research: the modified Z-test. The modified Z-test resolves the reliability issue with median, where the z-score is calculated using the formula below:
Here, xi represents each data point, represents the median of , and represents the i X ~ X
estimated standard deviation using MAD. The MAD stands for median absolute deviation, defined as the absolute values of the residuals from the data’s median (Thomas, 2021).
MAD is a more robust measure of statistical dispersion, being more resilient to the outliers in a data set than the standard deviation. However, to use MAD as a consistent estimator for the estimation of σ, we need to take a constant scale factor k, which depends on the distribution(Thomas, 2021). A consistent estimator is an estimator with the property that the probability of our estimated value and the true value of the population parameter to be σ arbitrarily close to each other(Thomas, 2021). According to my research, for a normally distributed data, k≈1. 4826(Zaiontz,2023), and we have:
Using these, I have decided to filter out all data that does not fit in the range of 土2
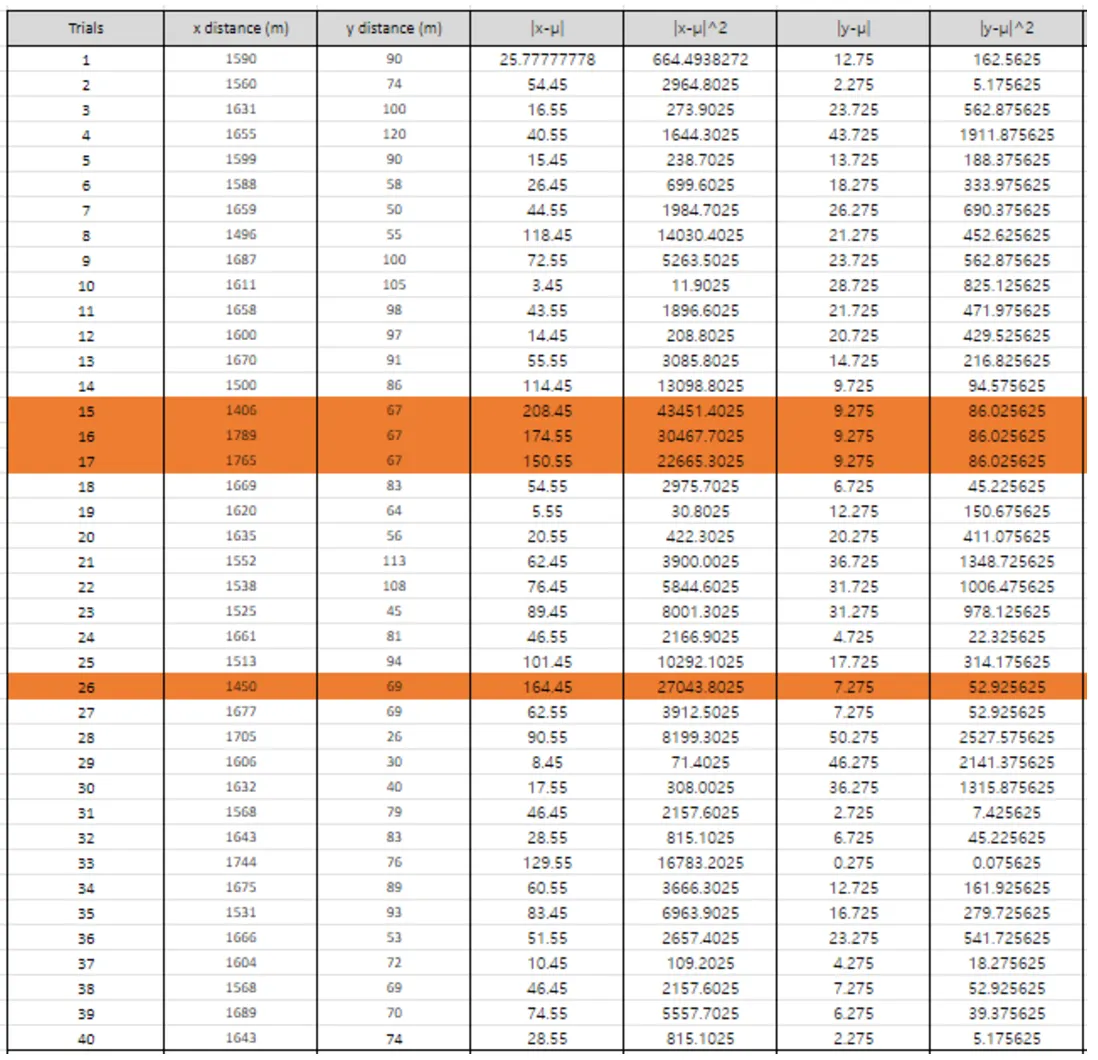
Figure 4: Finding the new mean value
Criterion A: 4 out of 4Clear and structured presentation of data should highlight and reinforce insights. The highlighted rows indicate which data points are excluded as outliers.
New mean for x and y Mean of x:
58168 ÷ 36 = 1615. 77778
≈ 1616
Mean of y:
2781 ÷ 36 = 77. 25
≈ 77
Standard Deviation
With the mean value(µ) and the N value, which is the number of data points, the standard
deviation follows a certain formula which is(National Library of Medicine,2012):
One of the math tools that I used to further analyze the graph was to draw a normal distribution diagram which enables me to understand the highest percentage of where the brick could fall to find the dimension.
Finding length of Y- dimension
Therefore, in order to calculate the value, the mean squared
When 18375.15938 is divided by the N value(36),
SD=22.592500831028
SD≈23
To conclude my data, the mean value is about 77 and the standard deviation is 23. Therefore, to represent this as a normal distribution diagram
Criterion E: 2 out of 6 (HL standard)Although criterion E is evaluated holistically throughout the report, this example alone demonstrates very little mathematical sophistication. The student merely substitutes values into a formula, which does not necessarily demonstrate understanding of the results.
Criterion E: 4 out of 6 version (HL standards)
Criterion E: 6 out of 6 version (HL standards)
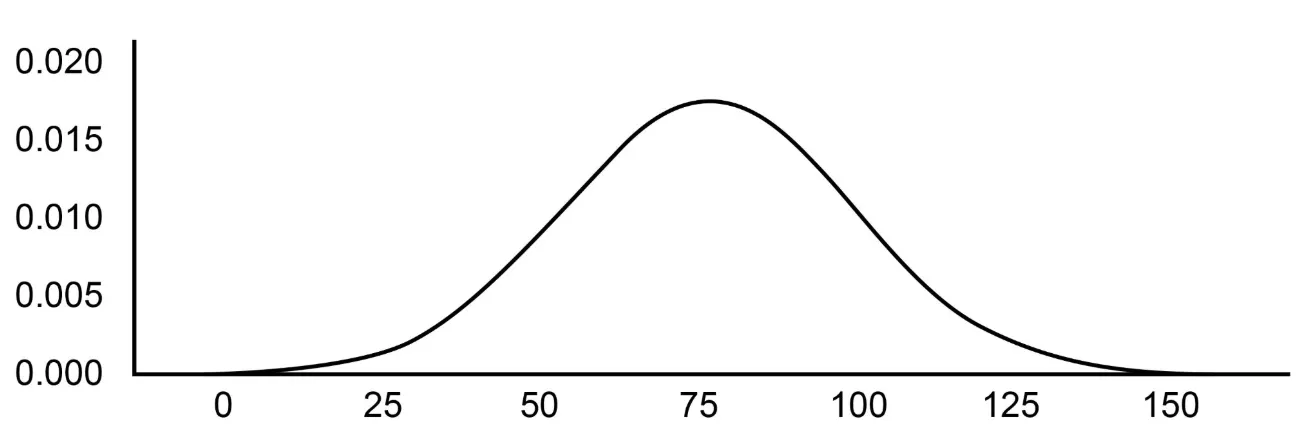
Figure 5. The normal distribution diagram of the vertical distance the brick fell
Missing axis labels and units for the graph. Such graph would receive 2/4 in Criterion A.From the normal distribution graph, I can find the range of where the barrier could protect 95% probability of the region where the brick falls. To find this, will find the inverse normal of the are 0.95
X~N(77. 25 ,22. 5925008310282)
InvNorm(0.95,77,22)= 113.18677976995
≈ 113
Therefore, it could be seen that the length of the barrier should be 0≤ 𝑦 ≤ 113cm
Finding length of X- dimension
SD=60.98141368482
7 SD≈61
Criterion D: 1 out of 3This is an example of simply describing results without deep analysis, representing a limited reflection.
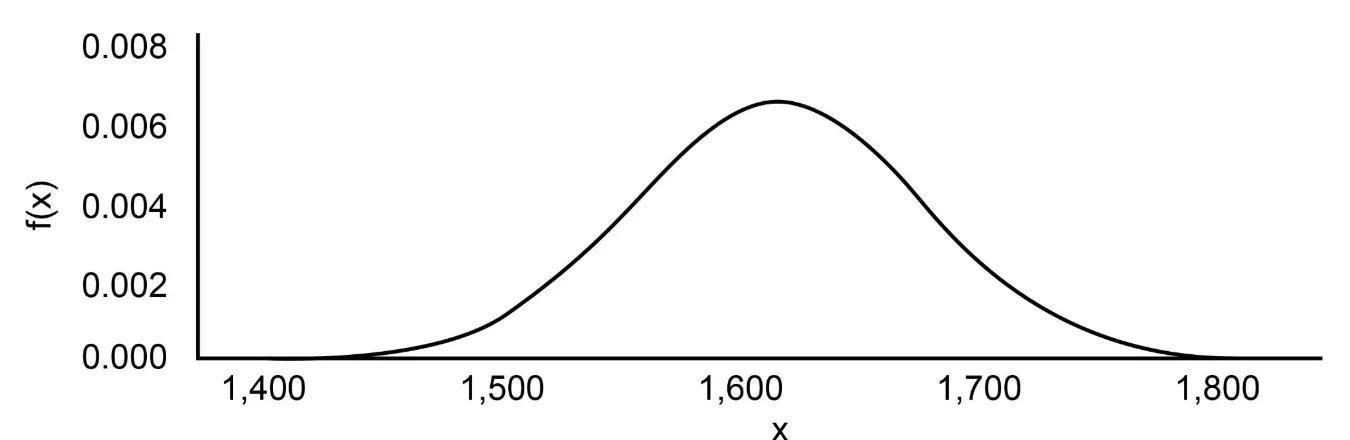
Figure 6. The normal distribution diagram of the vertical distance the brick fell
There is neither units nor context to the axis label. Consequently, such presentation would receive 2/4 in Criterion A.All in all, to conclude the finding, the dimension of the barrier should be 0x0≤ 𝑑𝑖𝑚𝑒𝑛𝑠𝑖𝑜𝑛 𝑜𝑓 𝑏𝑎𝑟𝑟𝑖𝑒𝑟 ≤113. 18677976995×1716.3360711803
0≤ 𝑑𝑖𝑚𝑒𝑛𝑠𝑖𝑜𝑛 𝑜𝑓 𝑏𝑎𝑟𝑟𝑖𝑒𝑟 ≤194267
The barrier would be safe if it is between to
Criterion B: 2 out of 4The student does not demonstrate a solid understanding of the tool (ex: Inverse Norm) that is used. There must be an explanation of the tool's function, purpose and analysis results to avoid confusing the readers and making them overlook important mathematical reasoning behind the function's application.
Criterion B: 3 out of 4 version
Criterion B: 4 out of 4 version
5. Impulse
We can calculate the impulse to estimate the force exerted on the safety nets. Impulse (𝐽) is
measured as the change in momentum (∆𝑝) of an object, and numerically expresses the
amount of force exerted in a short time during the impact of collision(Vaia, 2023).
As it is difficult to calculate this impulse experimentally, I have decided to use the free-fall model in physics to theoretically estimate the impact exerted on the safety nets. To avoid
over-complication of our model, I assumed that the brick would fall linearly. However, before conducting calculations, I noticed that the direction of the brick fall would affect the amount of impact caused on the safety nets. For example, from the figure above, there will be more resultant force acting on the safety nets if the brick falls in area 𝑏 rather than area 𝑐.
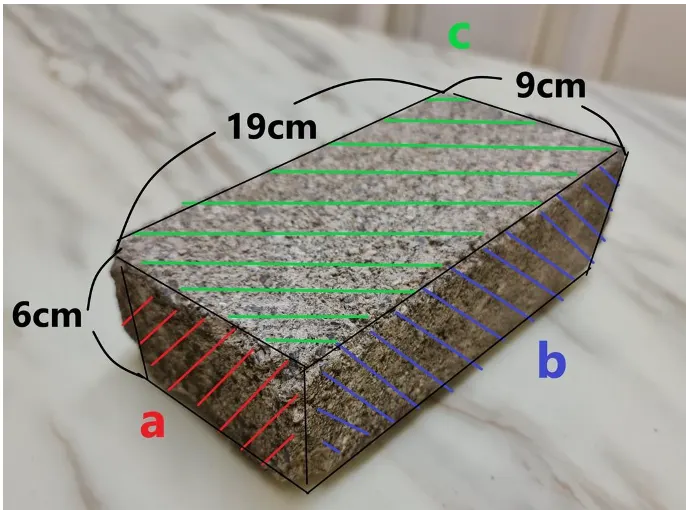
Figure 7. 3 Sides of brick
Criterion D: 3 out of 3This shows a critical reflection on methodological limitations and improvements to decision-making processes, considering implications of results. To demonstrate insightful reflection, the student must challenge his/her own assumptions and acknowledge limitations.
This is due to the increasing air resistance depending on the surface area of the object during the fall(Lincoln,2020).
The drag force is proportional to the square of the velocity of the object and can be calculated using the drag coefficient 𝐶 (1.16 for a brick), and the surface area , and the fluid density ρ.
As , we have:
The object reaches the terminal velocity 𝑣 after a certain time where the air resistance 𝑇
balances the gravitational force, which then allows the object to fall in a uniform motion. As
the acceleration is 0 at terminal velocity, substituting the known values into the motion
equation above:
The density of air is given as (AMA, 2017) and is known to be 1. 16 for
the brick.(Brown,2019). As Newton’s second law of motion states we have the
following motion equation:
Criterion B: 2 out of 4The symbols and variables are not clearly defined. Especially for interdisciplinary topics (ex: physics), the exploration should be clear and understandable for the examiner by defining variables that are not universally understood in mathematics.
Criterion B: 3 out of 4 version
The object reaches the terminal velocity 𝑣T after a certain time where the air resistance balances the gravitational force, which then allows the object to fall in a uniform motion. As the acceleration is 0 at terminal velocity, substituting the known values into the motion
equation above:
Criterion B: 4 out of 4In this part of the calculation, there is an explanation contextualizing the calculation to enhance understanding (explanation of the real-life context).
Tip: Use multiple forms of mathematical representation (formula, diagrams, charts, graphs...) to enhance mathematical communication.
Then, as mentioned above, we obtained the relationship between the terminal velocity and the
surface area.
Also, as we can calculate the acceleration by substituting the definition of the terminal
velocity in the motion equation above:
Since acceleration is the derivative of velocity, we the equation could be presented as:
Solving this separable differential equation yields:
Criterion B: 2 out of 4The student does not explain what each variable represents. Though they seem intuitive, all mathematical calculations and variables should be clearly explained (unless they are universally accepted).
Criterion E: 6 out of 6 (for SL standards)For SL students, demonstrating mastery of modeling and solving differential equations is sufficient for high marks in this criteria (given that you use the mathematics correctly). Solving basic first-order differential equations by separating variables and integrating to model the motion of a falling brick is a more-than-enough maths for SL students.
LHS(Left Hand Side of the equation):
RHS(Right Hand Side of the equation):
where 𝐶 is the constant of integration.
Criterion B: 2 out of 4When outlining derivations and proofs, ensure that the equal signs are aligned vertically.
Furthermore, explanation for the process of calculation is needed (don't make logical jumps)
Criterion B: 3 out of 4 version
Criterion B: 4 out of 4 version
Then,
Substituting into the equation above, we obtain a function in terms of the surface area and time.
If we set the initial velocity as 0, 𝑡 = 0, this enables to calculate the 𝐶 𝑣𝑎𝑙𝑢𝑒:
Criterion B: 4 out of 4Like how the student has done here, one must periodically review the calculations and summarize the intermediate results to revisit one's objectives and showcase commitment to accuracy and coherence. Constant checks help you stay on track and strengthen the logical flow of calculations.
Thus, the final velocity function in terms of the surface area and time would be:
Now, in order to find the time, we have to use the theoretical velocity height that allows one to find the time.
The minimum impulse value is obtained by Mass x Velocity (M.Katie,2016)
Theoretical Velocity formula:
V(t)=9.81t
*G= acceleration of gravitational pull, which is 9.81 IB* Equation for height
From our experimental result, the falling time was 4.63. Now, by substituting the known values, we can calculate the final velocity:
1.
If the brick falls in the area , the As is is 1.16, and m is 2kg, and finally the t value is 4.63 which gives
This gives the result of 0.007053
2.
If the brick falls in the area , . AS ρ is 1. 293 and is 1.16, and 𝑚 is 2𝑘𝑔,
This gives the result of 0.022205
3.
If the brick falls in the area , As ρ is and is 1.16, and m is2kg ,
This gives the result of 0.039742
This enables me to find the range of the minimum impulse.
Area A
2×0.007053 = 0.014106
Area B
2×0.022205 = 0.044409
Area C
2× 0.039742 = 0.079484
All in all, the range of the minimum impulse is
0. 014106 ≤ 𝑚𝑖𝑛𝑖𝑚𝑢𝑚 𝑖𝑚𝑝𝑢𝑙𝑠𝑒 ≤ 0.079484
To critically analyze the nets, I will refer to the report < Absorption of Safety Nets in Building Construction> by E. G. Segovia Eulogio & R. Irles Más. Here, the structure that I will use is the “V” safety nets. (the V safety nets are referred on figure8) In the report, the conclusion could be made that the total energy to be absorbed is approximately 7.7 kJ in the potential corresponding to a mass of 100 kg falling from
7.9 m. With the reference with the previous findings, I could find how much the brick could hold if applied on my finding to see if a V shaped safety nets could hold without ripping.
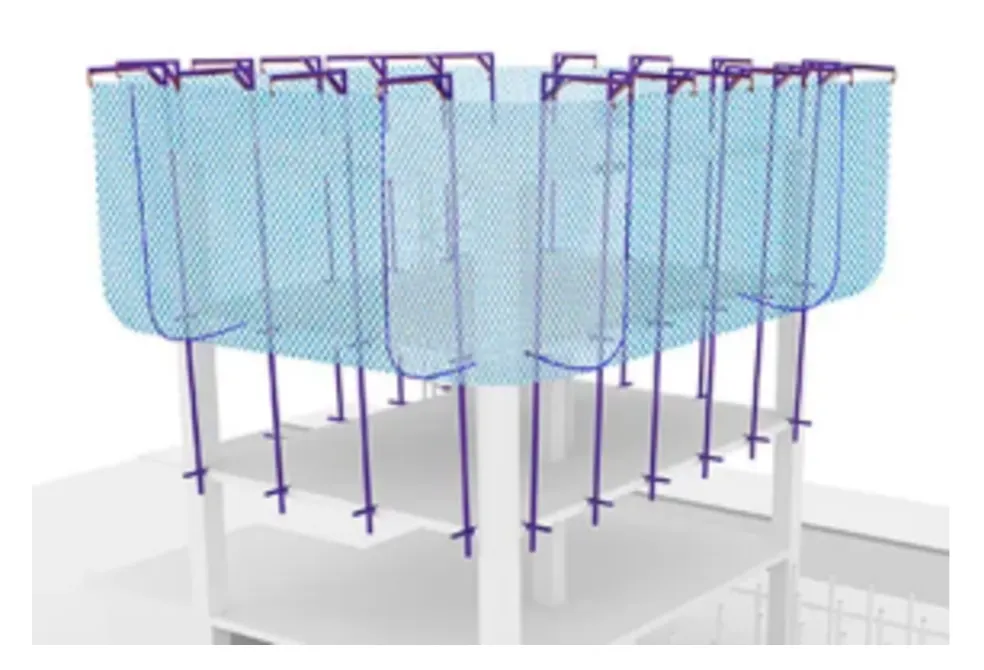
Figure 8: V Safety Nets
Since mass x velocity is the minimum impulse, dividing 2 for the range of impulse provides me with the energy that could be absorbed
(0.079484)
= 0.007053≤ 𝐸𝑛𝑒𝑟𝑔𝑦 𝑉 𝑠ℎ𝑎𝑝𝑒 𝑛𝑒𝑡𝑠 𝑐𝑜𝑢𝑙𝑑 𝑎𝑏𝑠𝑜𝑟𝑏 ≤ 0.039742
By converting into kJ, 1 Joule per Kilogram = 1 Square Meter per Square Second. Therefore, 1 Square Meter per Square Second = 0.001 Kilojoule per Kilogram.
By converting the minimum impulse into Kilo Jewels,
∴ 3.9742E-5 ≤ 𝐸𝑛𝑒𝑟𝑔𝑦 𝑎𝑏𝑠𝑜𝑟𝑏𝑒𝑟 𝑡ℎ𝑎𝑡 𝑉 𝑠ℎ𝑎𝑝𝑒 𝑛𝑒𝑡𝑠 𝑐𝑜𝑢𝑙𝑑 𝑡𝑎𝑘𝑒 ≤ 7.053E-06
The V shape nets perfectly covers the impulse when a brick is dropped.
6. Conclusion and Evaluation
In this section, you are expected to discuss what was learned, and meaningfully reflect on whether the exploration met its goals. Emphasize practical knowledge gained and tie it back to your initial rationale/aim/personal engagement.To conclude, the range of the protective barrier should be between to 194267 and the minimum impulse of a brick is between 0. 014106 and 0.079484. Since a normal force that does the slightest damage in the human head is 84 grams, a 2kg brick not only would injure one, but also lead to death. In order to ensure safety of the workers, the “V” Shape net is the most appropriate type that ensure maximum safety for the workers. All in all, my investigation uses mathematical calculations within this exploration that could be applied since the mathematical formula could be used on future projects. For instance, to find out the range of the distance, the Z modified test could be used in a freefall condition. Furthermore, with sufficient data, to ensure the safety of the hard hat and the impulse, using the formula to find the velocity could provide the range of impulse that could injure a worker’s head. This will increase the safety in the construction field overall.
Criterion D: 2 out of 3This example establishes a real-world context for values and connect calculated results to a relatable standard. Hence, it is crucial to make connections between mathematical findings and real-world implications.
For instance, relate impulse and force values to known safety standards for head protection and comment on how the calculated forces far exceed safe limits.
For my investigation, there are clear limitations. To begin, the investigation used formulas and conditions that could be similarly applied into other investigations or projects relating to my project. Yet, there is a limit that some conditions might not be considered. The specific type of net should have been clearly stated before the investigation. There are two types of nets (Knotted construction net, Knotless construction net), and the purpose differs based on the material used. For a net that is specified to project an object in a freefall condition, Polypropylene polyamide 6 is the most common material. From the category of a safety net, different nets pose strength and weakness. Some types of nets are built to be resilient and difficult to rip apart, but they show vulnerability to heat or cold weather. Also, as some show strength on constantly changing weather conditions, they are vulnerable to rip apart when a certain force is aggravated.
Moreover, the investigation used to find the time could have an outlier from the actual result. During the experiment, I failed to measure the time of fall of a brick. Therefore, I had to use a theoretical formula using the height inorder to find the time of fall. The theoretical velocity formula is 9.81𝑥 𝑡. The formula fails to consider the factor of air resistance. The factor of air resistance could be ignored, but this decision would rather increase the error range since a theoretical situation does not cover all possible influences that could affect the fall of a brick. Air resistance depends on the area , and shape of an object when the brick falls down. Especially, from a certain height, the altitude, temperature, and humidity change air density and resistance are all the possible factors that affect the result(Lincoln,2020). Since my experiment is dropping a Quadrilateral brick from a height of 105m, the brick should be affected by the air resistance.
Criterion D: 3 out of 3This part demonstrates a comprehensive reflection on the entire development process, suggesting future research directions. The student considers a variety of factors which were ignored in the calculations, such as weather conditions and air resistance.
Despite the possible limitations, the investigation is significant since the work refers to a problem that is commonly seen in everyday life in the streets of Hanoi. When implementing my investigation, workers in the construction field could ensure safety in a risky situation.
Overall feedback:
Criterion A - Presentation (2 out of 4)
•
The student shows some coherence and organization. The physics part loses the reader a little.
Criterion B - Mathematical Communication (1 out of 4)
•
There are tables, graphs and equations that are not labeled properly. Also, not all symbols are defined and there are graphs and tables lacking units.
Criterion C - Personal Engagement (2 out of 3)
•
Collected own data, worked on integration which had not been looked at in class when the IA was due.
Criterion D - Reflection (2 out of 3)
•
The student shows adequate reflection throughout the report, such as the effect of wind and consideration of which Z test to use.
Criterion E - Use of Mathematics (5 out of 6, SL standards)
•
The use of normal distribution, Z-test, integration, mean and standard deviation is quite sufficient for SL standards. However, the unclear mathematical communication affects the student’s use of mathematics, preventing this report from getting a 6 in criterion E.
Work Cited:
Brown, Matt. “What Kind of Fuel Mileage Would a Brick Wall Get?” Jalopnik, Jalopnik, 17 Nov. 2019,
jalopnik.com/what-kind-of-fuel-mileage-would-a-brick-wall-get-1839901794#
:~:text=According%20to%20the%20book%20Fundamentals,so%201.16%20is
%20pretty%20high.
“Change of Momentum: System, Formula & Units | Vaia - StudySmarter US.” Momentum Change and Impulse: Formula & Theorem, HelloVaia, www.hellovaia.com/explanations/physics/linear-momentum/change-of-mome ntum/. Accessed 8 Sept. 2023.
“Finding and Using Health Statistics.” U.S. National Library of Medicine, National Institutes of Health,
www.nlm.nih.gov/oet/ed/stats/02-900.html#:~:text=A%20standard%20deviati on%20(or%20%CF%83,data%20are%20more%20spread%20out. Accessed 8
Sept. 2023.
Frost, Jim. “Mean Absolute Deviation: Definition, Finding & Formula.” Statistics By Jim, 6 July 2023, statisticsbyjim.com/basics/mean-absolute-deviation/.
Ixoadmin. “Safety Nets : Certified System V Type - VISORNETS - Visor Fall Arrest Nets.” Visornets, FASET, 27 Nov. 2018,
M, Katie. “Impulse (2.4.2): DP IB Physics: SL Revision Notes 2016.” 2.4.2 Impulse, Save My Exams,
www.savemyexams.com/dp/physics_sl/ib/16/revision-notes/2-mechanics/2-4- momentum--impulse/2-4-2-impulse/. Accessed 8 Sept. 2023.
“Momentum Change and Impulse.” Momentum Change and Impulse Connection,
The Physics Classroom,
www.physicsclassroom.com/class/momentum/Lesson-1/Momentum-and-Impu lse-Connection#:~:text=The%20impulse%20experienced%20by%20the,to%2 0the%20change%20in%20momentum. Accessed 8 Sept. 2023.
Segovia Eulogio, E.Energy absorption of safety nets in building construction G., and
R. Irles Más. “Experimental and Numerical Investigations on Projectile Penetration ...” Energy Absorption of Safety Nets in Building Construction , Department of Civil Engineering, University of Alicante, Spain, 2006, www.witpress.com/Secure/elibrary/papers/SU06/SU06022FU1.pdf.
Sir, Balram. “What Is the Weight of a Standard Brick and Their Size.” Civil Sir, 27 July 2023, civilsir.com/weight-of-a-brick/.
“Terminal Velocity.” NASA, NASA,
www.grc.nasa.gov/www/k-12/VirtualAero/BottleRocket/airplane/termv.html. Accessed 8 Sept. 2023.
Thomas, Sarah. “Mean Absolute Deviation (MAD): What It Means and How to Find It.” Outlier, Outlier, 8 Dec. 2021,
articles.outlier.org/mean-absolute-deviation-meaning.
Zaiontz, Charles. “Real Statistics Using Excel.” Identifying Outliers Using MAD , Real Statistics Using Excel,
real-statistics.com/descriptive-statistics/mad-and-outliers/. Accessed 8 Sept. 2023.