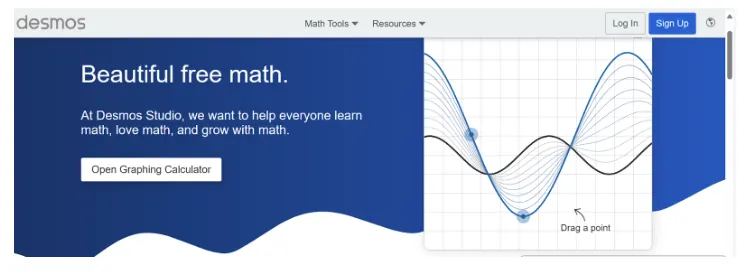
Desmos is an interactive graphing tool for math visualization.
Accessing Desmos
•
Create a free account to save and share graphs.
Using Desmos
•
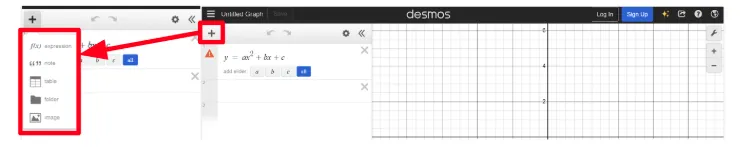
Use the left-hand input panel to enter equations or data points.
◦
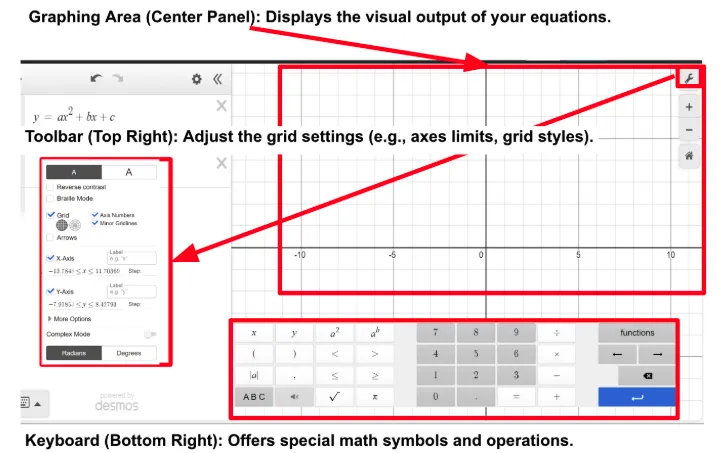
Expression List (Left Panel): Input mathematical equations, functions, and variables here.
◦
Data can be entered as ordered pairs (e.g., (2,3)) or as a table.
•
A wide array of customization options is available on the Desmos Interface
◦
Styling Graphs: Change line colors, thickness, and point styles.
◦
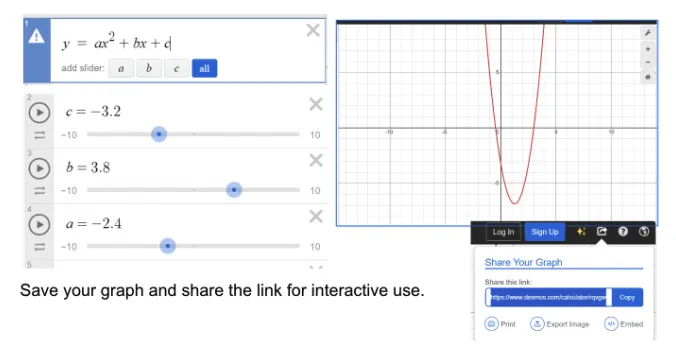
Sliders: Introduce sliders to dynamically adjust parameters in equations.
◦
Annotations: Add notes directly to graphs for context.
General Tips
•
Highlight key features like intercepts, asymptotes, or maxima/minima.
•
Save graphs to share or embed in IA documentation.
•
Use sliders to dynamically adjust variables in equations and apply instant graph updates for equations and datasets.
•
Dynamic sliders make it easy to explore how changes in variables affect the model.