

Excel remains a versatile and accessible tool for handling numerical data. With built-in formulas, functions, and macros, you can efficiently perform complex calculations and analyze results.
Excel’s interface makes it ideal for small-scale data analysis, quick calculations, and visualization through built-in charting tools.
Macros save time for repetitive tasks and reduce human error in manual calculations.
Key Techniques for Numerical Analysis in Excel:
1.
Using Formulas for Data Analysis:
•
Use functions like =AVERAGE(), =STDEV(), or =LINEST() for quick statistical analysis.
•
Create a trendline for scatter plots with regression equations directly displayed.
2.
Creating Dynamic Models with Spreadsheets:
•
Use Excel's ability to compute calculations dynamically by linking cells. For instance:
◦
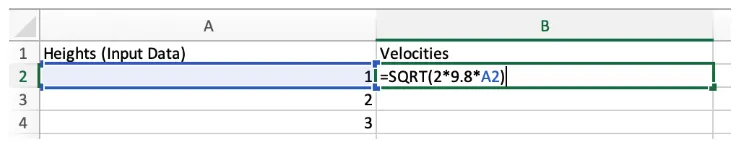
Column A: Heights (Input Data)
◦
Column B: Velocities (Calculated using a formula like
=SQRT(2*9.8*A2) for freefall speeds).
•
Write “=” at the beginning of a cell value to use functions or perform calculations.
•
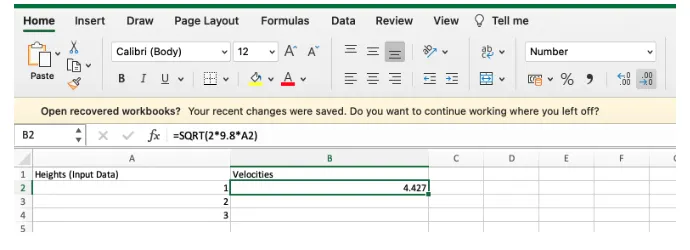
Cell B2 will use the value input into cell A2 in computing the expression, “sqrt(29.8A2)”.
•
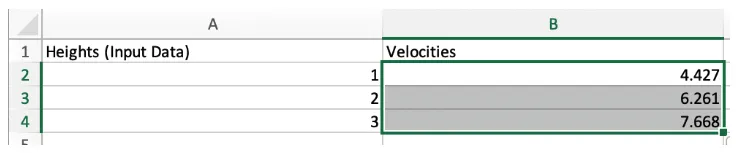
Hover your mouse to the bottom right corner of cell B2 and drag downwards to perform repetitive calculations.
•
Instead of having to update the expression each time, each cell in column B will automatically reference the corresponding value in column A for its calculation.
•
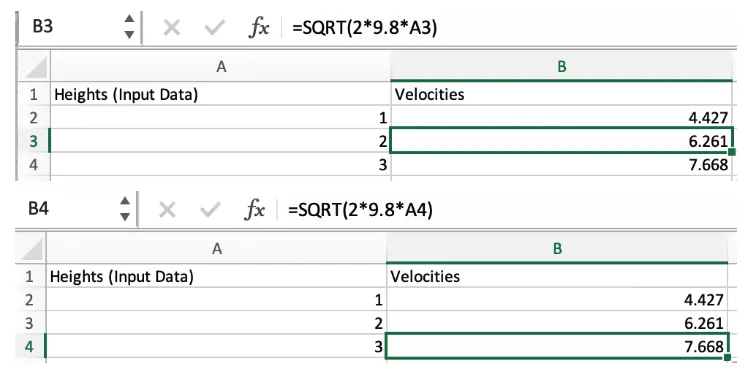
For example:
◦
Cell B3 will perform a calculation based on the value in Cell A3.
◦
Cell B4 will use Cell A4, and so on for the entire column.
3.
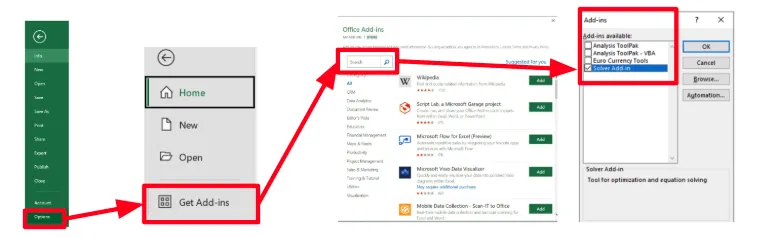
Unlocking add-in tools for analysis:
•
In addition to the core features (basic arithmetic and statistical analysis), Excel Add-ins can significantly extend its functionality for more advanced data analysis and visualization
•
Select Manage and choose Excel Add-ins > Go
◦
Alternatively, go to File > Options > Add-ins (may vary depending on Excel version)
◦
This opens the dialog box for searching add-ins you want to use (like Solver).