

Logger Pro is a specialized tool for scientific data collection and analysis and can be used for curve fitting in math IAs.
Installing Logger Pro
•
Download from Vernier's website: https://www.vernier.com/downloads/logger-pro-demo
Inputting Data
•
Enter data manually into columns or copy & paste from external spreadsheets / tables.
•
Logger Pro will automatically create a scatter plot based on the (x,y) data.

Commonly Used Features
•
Analyze > Curve Fit > Select General Equation (Fit Type: Manual)
◦
This allows you to experiment with trendlines based on a wide array of parent functions (linear, quadratic, cubic, sinusoidal, logarithmic, exponential, and much more!)
◦
If none of the available options seem to fit your dataset, you can create your custom function using the “Define Function” option.

•
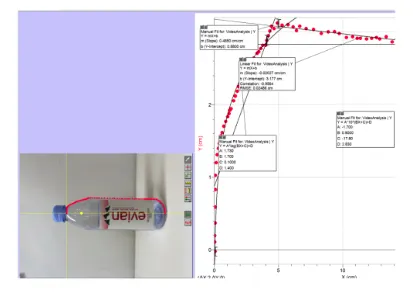
Insert > Picture or Movie… > Photo/Video Analysis Tool
◦
Images or video frames can be imported into Logger Pro to create detailed traces by marking specific points of interest.
◦
For example, if analyzing the outline of a bottle, users can manually place markers along the edges in a single image or multiple frames of a video. Each marker's x and y coordinates are recorded, and these points are used to generate a plot or trace that visually represents the selected pattern or structure.
◦
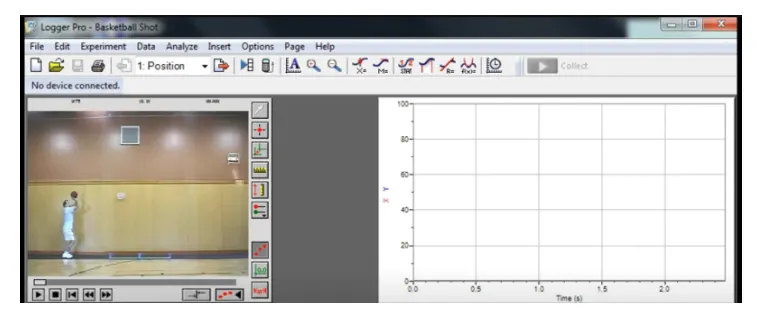
This feature can be applied not only to static objects (to study geometry, shape, and spatial relationships), but also to moving objects (e.g. projectile motion of a ball) for kinematic analysis.
•
Check out the official reference manual for in-depth tutorials
Tips:
•
Export graphs as images to include in IA reports.
•
Use Logger Pro’s video analysis feature to analyze motion data or real-world experiments.