

4.1 Introduction
Start your introduction with a concise statement summarizing the article while linking to your WISE ChoICES concept.
For example:
In response to the economic challenges caused by the COVID-19 pandemic, the U.S. government introduced fiscal stimulus measures, including $1,200 direct payments to individuals and a $600 weekly unemployment boost. These demand-side policies were designed to stimulate aggregate demand (AD) and reduce unemployment, which peaked at 14.8% in April 2020. The article highlights how these interventions were crucial in stabilizing the economy and supporting welfare through fairer resource distribution and reduced financial hardships.
Criterion B (Terminology):
•
The introduction effectively uses key economic terms like "fiscal stimulus," "aggregate demand," and "unemployment," demonstrating clear understanding of the concepts.
Criterion D (Key Concepts):
•
It links the analysis to welfare (improving well-being).
4.2 Structuring Diagram & Analysis
Diagrams are crucial in IB Economics, and your IA is no exception. Here’s how to ensure they enhance your work:
•
Size and Clarity: Make sure diagrams are large, clear, and well-labelled, especially axes.
•
Presentation: Avoid drawing diagrams on paper and scanning them
•
Connect Analysis: Link your analysis back to the diagram to show understanding.
•
Incorporate Article Data: Add relevant article data to provide context
#Advice: Imagine the examinator can’t read your commentary and can only look at your diagram, therefore include relevant figures from the article in your diagram.
Initial
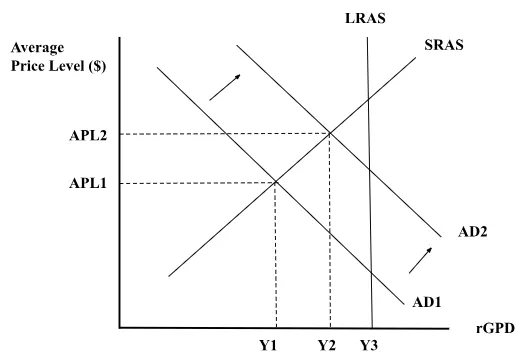
Figure 4.2 1 U.S. Expansionary fiscal
Detailed
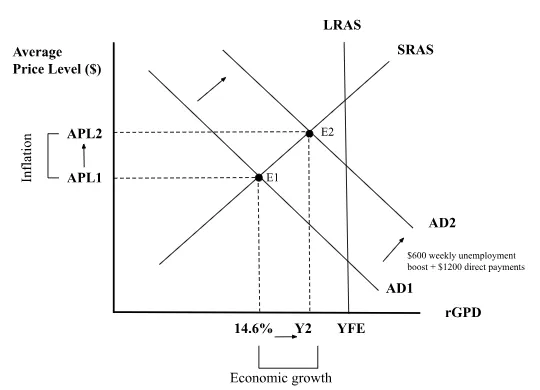
Figure 4.2.2 Impact of expansionary fiscal policy for US economy 2020
Criterion A - Level 2
The diagram is relevant but lacks sufficient labeling, arrows, and specific context. While it illustrates the general idea, it is not fully explained or detailed enough for meaningful analysis.
Criterion A - Level 3
The diagram is relevant, accurately labeled, and fully explained. It effectively illustrates the situation and supports detailed analysis of price, production, and stakeholder impacts.
The detailed diagram is an excellent example of a well-developed IB Economics diagram, while the first one lacks the depth required for a thorough analysis. Here’s why:
•
Arrows for Shifts: Clearly shows changes in AD while illustrating why it shifts outwards, making the diagram easy to interpret.
◦
Due to expansionary fiscal policy, AD1 → AD2
•
Detailed Labels (E2, E1, YFE and Inflation, Economic Growth): These labels show in-depth analysis by linking sections to how economic growth is achieved and how inflation increases.
◦
When explaining, the student can say: The increase in economic growth from Y1 → 14.8% will increase in APL1 → APL2 resulting in inflation.
◦
Similarly, this diagram illustrates where YFE showing where the economy is at full employment
•
Statistics implementation Adds real-world relevance, showing how weekly unemployment boost and direct payment affects AD, which strengthens the application of economic theory.
Exemplar Analysis:
The core issue addressed in the article is the economic contraction triggered by the COVID-19 pandemic, leading to an immense drop in aggregate demand (AD) and a spike in unemployment. This demand shock led to reduced consumer spending, lower business investment, and a deep economic downturn. The central problem was the insufficient aggregate demand, which hindered economic recovery, exacerbated income inequality, and created financial hardship for millions of people, necessitating immediate government intervention.
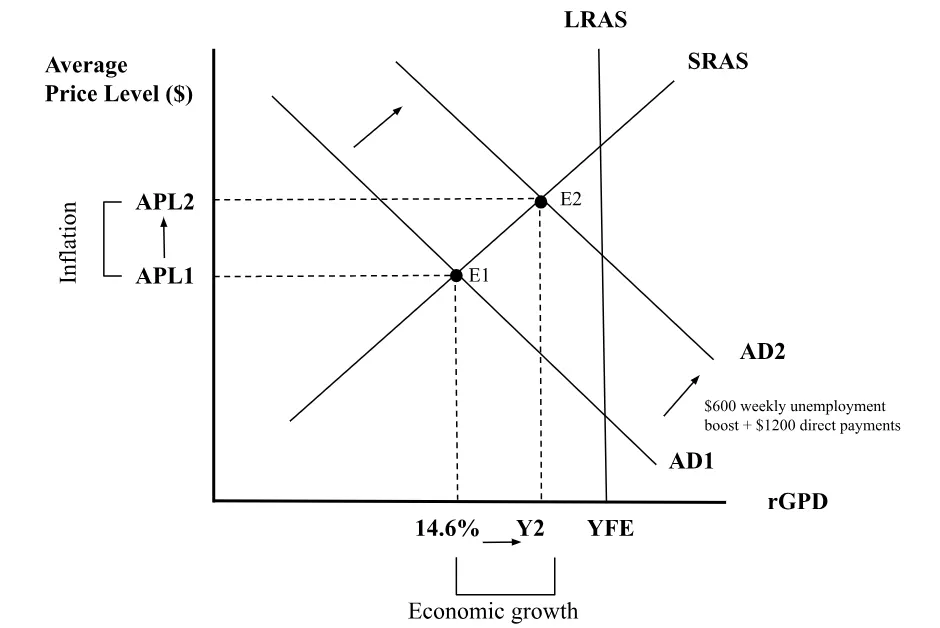
Figure 4.2.3 Impact of expansionary fiscal policy for US economy 2020
The primary objective was to shift aggregate demand (AD) to the right, encouraging higher consumption and business activity. In Figure 1, the fiscal policy's impact is shown by the AD curve shifting from AD1 to AD2, reflecting increased government spending, a key component of AD. This outward shift of AD stimulates output growth from Y1 (14.6%) to Y2, signaling economic recovery as firms increase production to meet higher demand. The Keynesian multiplier effect amplifies this impact, where the initial government spending leads to further rounds of spending and income generation, boosting overall economic activity. As demand rises, unemployment decreases as businesses hire more workers to handle the increased production. The diagram highlights the effectiveness of fiscal policies in stimulating economic recovery and mitigating the recession's negative effects, helping restore balance to the economy.
The proposed policy targeted those most affected by the pandemic, such as the unemployed and low-income households, who are more likely to spend rather than save. By boosting their income, the policy aimed to ensure a more equitable distribution of resources while preventing a prolonged economic downturn. However, the policy carried potential risks, such as inflation if demand grew too quickly or increased government debt from higher spending.
Criterion A (Diagrams):
•
Labeled diagram shows AD curve shift using arrows.
•
Links diagram to article context.
•
Explains how government intervention affects price, output, and employment.
Criterion C (Application and Analysis):
•
Applies economic theory (fiscal policy increasing AD).
•
Analyzes impacts on stakeholders (households, businesses).
•
Connects theory to real-world outcomes (lower unemployment, increased activity).
4.3 CLASPP
#Advice: Your IA commentary can focus on one of two things: criticize and evaluate the policy in the article OR suggest another policy that would be more effective and explain why.
The evaluation section of the IA rubric carries the most weight. While explaining the economic theory is important, analyzing it with the article's content is crucial to maximize your score.
•
Conclusion: In your IA, there are two types of conclusions you need to write.
1.
CLASPP Policy-Specific Conclusion: Summarize the key points from your commentary, including the policy’s effects, its strengths and weaknesses, and its impact on stakeholders.
2.
Overall Conclusion of IA: Tie together your analysis, evaluation, and suggested solution for the policy, highlighting its effectiveness and trade-offs.
•
Long-Run vs. Short-Run: Consider how the policy's effectiveness may change over time.
•
Assumptions: Identify any economic theories that the article overlooks and discuss their implications.
•
Stakeholders: Analyze how different groups (consumers, producers, government) are affected, noting who benefits and who loses.
•
Priorities: Evaluate whether the article aligns with policymakers' priorities in the economic context.
•
Pros & Cons: Assess the advantages and disadvantages of the policy presented in the article.
To do well in the evaluation section, pick at least two elements from CLASPP and write a paragraph on each. Keep it to 250-300 words, as this accounts for 40% of your IA score. Don’t overlook this part; a weak evaluation can lower your overall mark.
Improved
Initial
Conclusion (CLASPP)
The proposed policy targeted those hit hardest by the pandemic. By providing them with additional income, the government hoped to boost spending and support economic recovery. However, this approach carried risks, including possible inflation if demand increased too quickly or added government debt. Despite these concerns, the fiscal stimulus was essential for stabilizing the economy during the crisis.
Evaluation
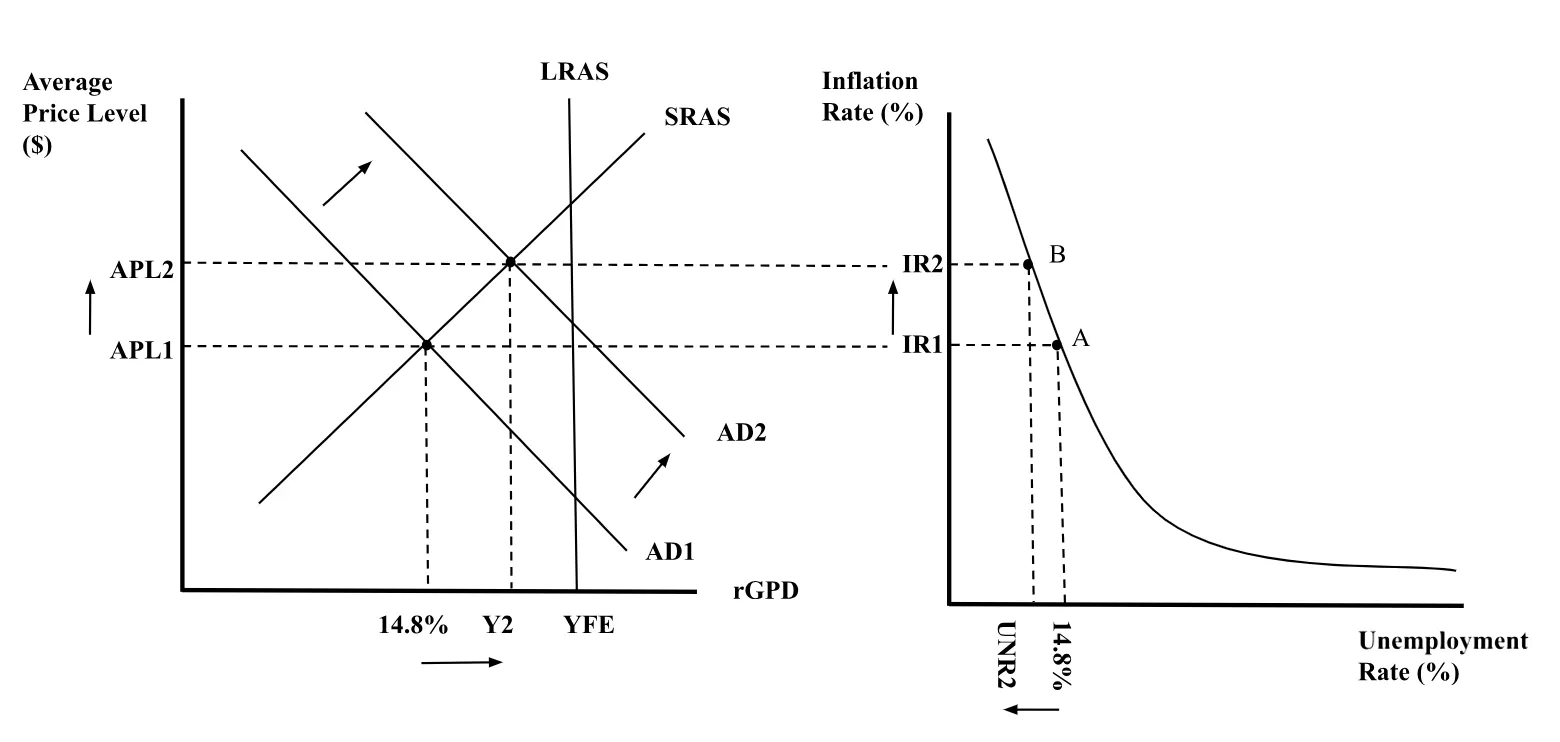
Figure 4.3.1 Relationship between unemployment and inflation in United States 2020
The expansionary fiscal policy in response to COVID-19 helped reduce unemployment and increase demand, shown by the rightward shift in the aggregate demand curve (AD1 to AD2) and a rise in price levels from APL1 to APL2. This effect is linked to the Phillips Curve, where lower unemployment might come with higher inflation.
In the long run, this policy might lead to higher inflation with reduced unemployment, reflecting the limits of expansionary fiscal measures. Low-income households could see reduced purchasing power from inflation, while businesses might benefit from more demand but face higher costs.
S. Solution
A more balanced approach might be supply-side policies like tax cuts for businesses or infrastructure investments, which could boost productivity and long-run growth without as much inflationary pressure.
Conclusion (IA)
In conclusion, expansionary fiscal policy can provide short-run benefits, but it might not work as well in the long term. Balancing inflation and unemployment is important for welfare, and supply-side policies could offer more lasting solutions.
Based on Criterion E: Evaluation, here is how the non-detailed example performs:
Level | Descriptor | Reasoning |
1 | Judgments are made that are unsupported, or supported by incorrect reasoning. | The evaluation mentions risks (e.g., inflation, government debt) and proposes supply-side policies but lacks depth, comparisons, and counterarguments. Stakeholder impacts are superficial, and alternative solutions are not well-analyzed.2 |
2 | Judgments are made that are supported by limited reasoning. | Some reasoning is present (e.g., inflation risks, potential benefits of supply-side policies), but it is underdeveloped. There are no clear comparisons or counterarguments, and the analysis does not fully evaluate short- and long-run impacts or stakeholder effects. |
Marks: This example would score 2/4 for Criterion E. While it touches on important points, the lack of depth, missing comparisons, and limited analysis prevent it from achieving higher marks.
To improve the writing:
•
Analyze Stakeholders and Terms: Detail impacts on groups (e.g., low-income households, businesses) and use precise terms like "fiscal stimulus" and "Phillips Curve."
•
Explain Graphs and Trade-offs: Describe AD shifts, price changes, and trade-offs like inflation vs. unemployment using theory (e.g., Phillips Curve).
•
Discuss Effects and Alternatives: Evaluate short- and long-run impacts, propose supply-side policies, and link analysis to the WISE ChoICES concept.
Improved
Detailed
Conclusion (CLASPP)
The proposed policy targeted those most affected by the pandemic, such as the unemployed and low-income households, who are more likely to spend rather than save. By boosting their income, the policy aimed to ensure a more equitable distribution of resources while preventing a prolonged economic downturn. However, the policy carried potential risks, such as inflation if demand grew too quickly or increased government debt from higher spending. Despite these risks, the fiscal stimulus was a crucial response to the immediate crisis, aimed at stabilizing the economy and supporting recovery efforts.
Evaluation
The expansionary fiscal policy used by the U.S. government in response to COVID-19 has clear short-run benefits, such as reducing unemployment and stimulating demand, as shown by the rightward shift in the aggregate demand curve (AD1 to AD2) and the increase in price levels from APL1 to APL2 in Figure 1. This is explained by the Phillips Curve, which illustrates the trade-off between inflation and unemployment in the short run. Lower unemployment is achieved at the cost of rising inflation.
However, there are long-run consequences to this policy. The Phillips Curve suggests that, in the long run, the economy adjusts, and the trade-off between inflation and unemployment diminishes as expectations of inflation rise. This leads to higher inflation without further reductions in unemployment. As shown in Figure 2, this shift to a higher point on the Phillips Curve from IR1 to IR2, from point A to point B and while unemployment rate to decreases from 14.8% to UNR2, this represents an economy experiencing inflation with a decrease in unemployment. illustrating the limits of expansionary fiscal policy in the long run.
Stakeholders are affected differently. Low-income households face a decline in real income due to inflation, while businesses benefit from increased demand but may face higher production costs. This inflationary pressure erodes purchasing power, reducing welfare, especially for the most vulnerable.
Suggested Solution
A more balanced approach might be supply-side policies, such as tax cuts for businesses or investments in infrastructure and education, which could increase productivity and reduce unemployment without adding to inflationary pressure. Additionally, prioritizing healthcare investments would better support economic recovery and welfare, particularly in the context of a post-pandemic world.
Conclusion (IA)
In conclusion, while expansionary fiscal policy offers short-run relief, it may not be sustainable or equitable in the long term. Balancing inflation control and unemployment reduction is crucial to ensure lasting welfare. Supply-side policies and healthcare investment could provide more sustainable solutions, enhancing welfare in the long run.
How does it check with the criterion?
Diagrams (Criterion A: Diagrams):
•
AD-AS and Phillips Curve diagrams illustrate theoretical points and clarify inflation and unemployment interactions, adding depth to the evaluation.
Criterion C: Application and Analysis
•
Examines both positive and negative impacts of expansionary fiscal policy, balancing short-run unemployment reduction against potential long-run inflation risks.
•
Uses economic theories like the Phillips Curve to show trade-offs between inflation and unemployment over time.
Insightful Evaluation Using CLASPP (Pros and Cons, Stakeholders, Long-Run vs. Short-Run):
•
Discusses pros and cons: short-run gains are weighed against inflation and debt concerns.
•
Stakeholder impacts are explored, noting inflation’s effects on low-income households and businesses.
•
Emphasizes long-run vs. short-run effects, explaining how inflation may erode purchasing power and policy sustainability.
Clear Alternatives:
•
Suggests supply-side policies and healthcare investments for sustainable recovery.