Modeling is a process of creating a mathematical representation of certain real-world scenarios. This falls under the statistics field, which requires some terminology in prior.
Terminology | Definition |
Population | Entire collection of individuals about which we want to draw conclusions |
Census | Information collected from the whole population |
Sample | Subset of population which could be chosen at random to avoid bias |
Survey | Collection of information from a sample |
Data | Information about individuals in a population |
Categorical variable | Describes a particular quality or characteristics which can be divided into different categories |
Numerical variable | Describes a characteristic which has a numerical value that can be counted or measured. There are two types: discrete and continuous. |
Discrete variable | Takes exact values and is often a result of counting |
Continuous variable | Takes numerical values within a certain range, and is often a result of measuring |
Random variable | A variable that is subject to random variations so that it can take on multiple different values, each with an associated probability. Often takes , etc. |
Parameter | Numerical quantity that measures some aspect of the population |
Statistics | Quantity calculated from data gathered from a sample |
Mean | The average of a data set: |
Median | The middle value in a sorted list of numbers. Given items, th item |
Mode | Most frequently occurring data |
Interquartile Range IQR | The difference between the upper quartile (75 percentile) and the lower quartile (25 percentile). |
Variance
| The squared deviation from the mean of a random variable.
|
Standard Deviation
| Statistical measurement that analyzes the distance of the data from the mean. This is a square root of the variance.
|
Terminology
Definition
Distribution

The pattern of a variation of data.
Outliers
A value that is much smaller or larger than most of the other values in a set of data. Different tests are utilized to identify the outliers.
Correlation
A measure of a relationship between the two variables

Regression
A method of fitting a curve through a set of points using some goodness-of-fit criterion
There are different ways of organizing the data:
Representation
Features
Frequency table
This is a frequency table for categorical variables:
, , follow the usual formula.
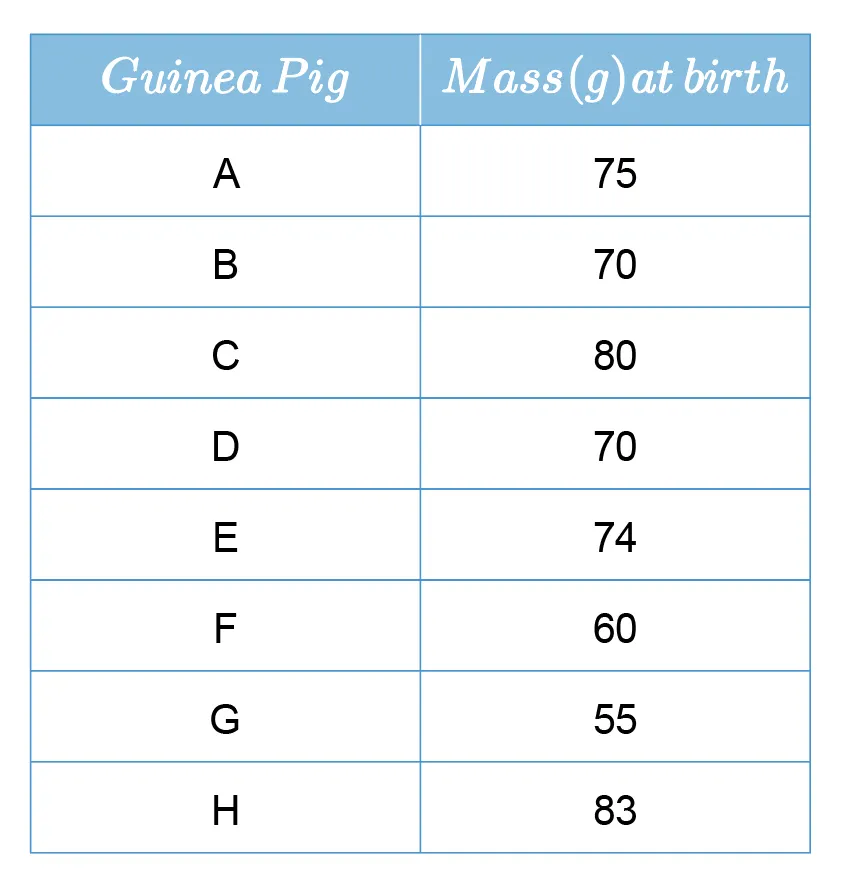
This is a frequency table with numerical variables:
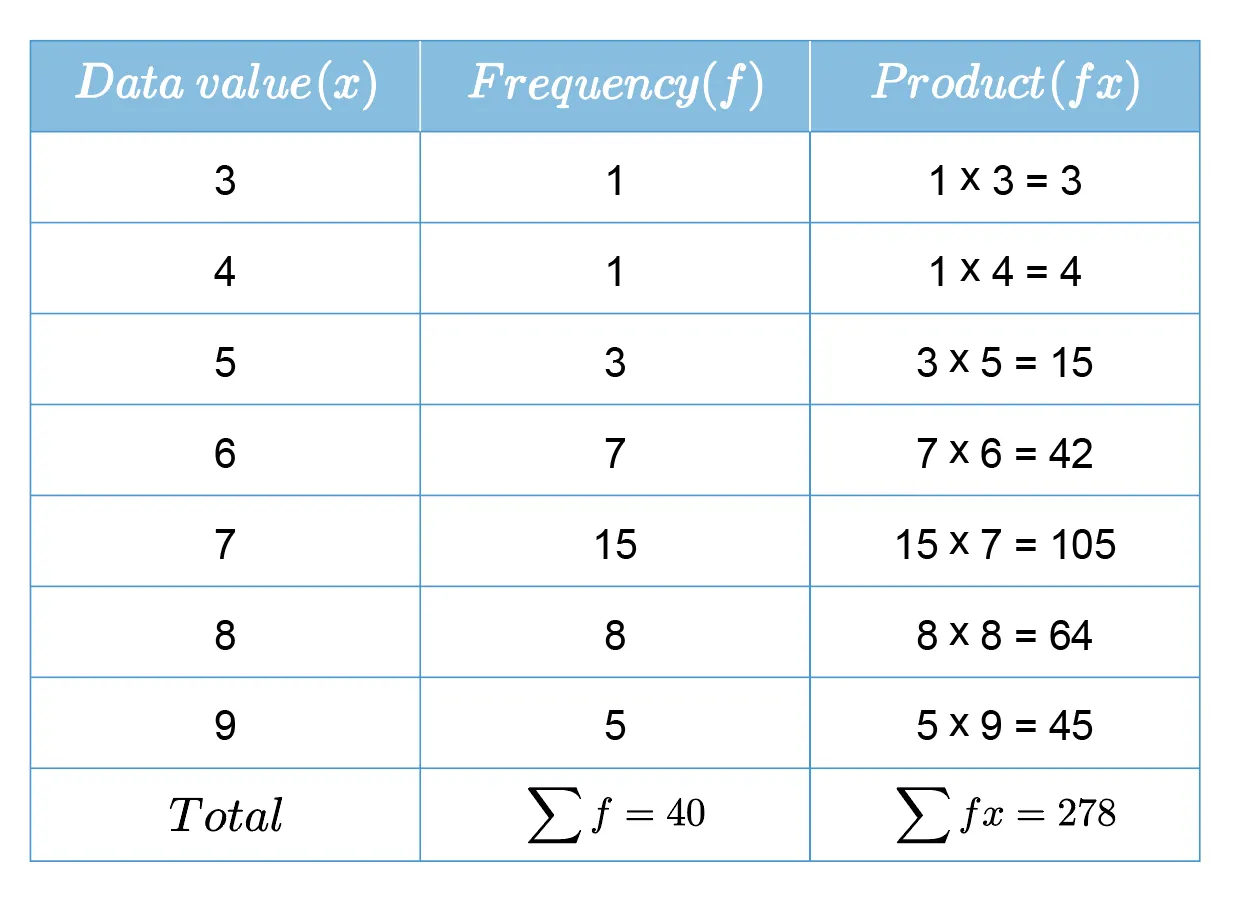
, and other measurements follow the usual formula.
This is a frequency table with class intervals.
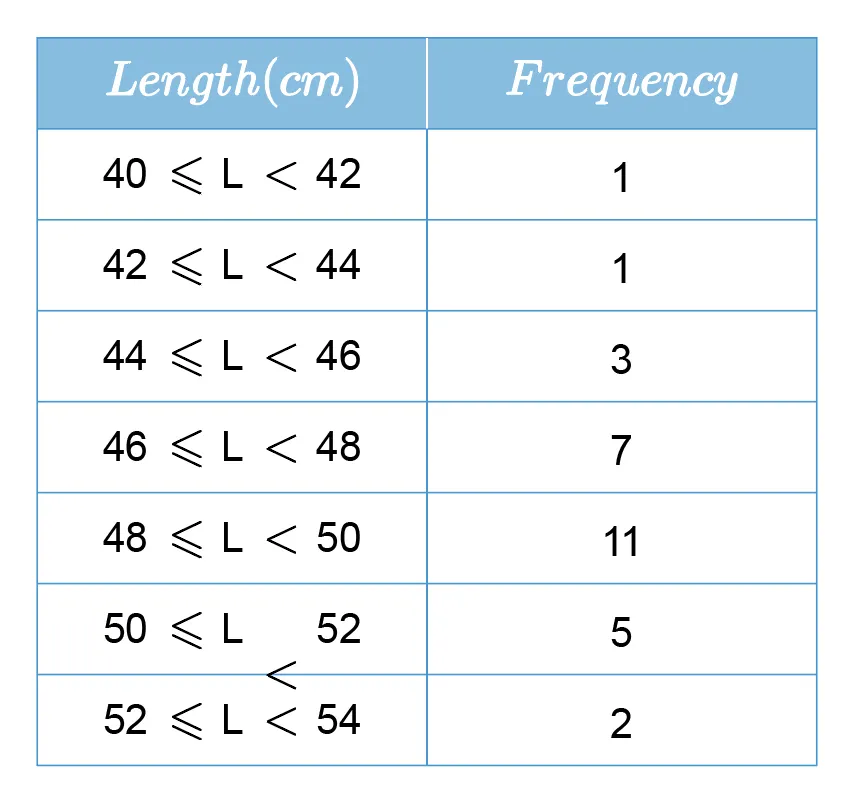
, and other measurements follow the usual formula.
Histogram

This is a representation of the frequency table in a bar graph.
Box and Whisker plot

If data or , this is an outlier.
Cumulative Frequency

Graph of the cumulative frequency with an independent variable.
The derivative of this function is in fact the
probability density function
There are different types of model (regression lines) you can utilize in bivariate statistics.
Model
Features
Line of best fit

Linear regression is used where bivariate statistics follow a linear trend. The line of best fit must pass through the mean point (, ). The bar notation is used for sample means.
Pearson’s Product-Moment correlation coefficient:
ranges from to , and the sign indicates the direction while the size indicates the strength of the correlation.
Coefficient of Determination indicates the degree to which change in the independent variable explains change in the dependent variable.