

Demand and supply curves forming a market equilibrium
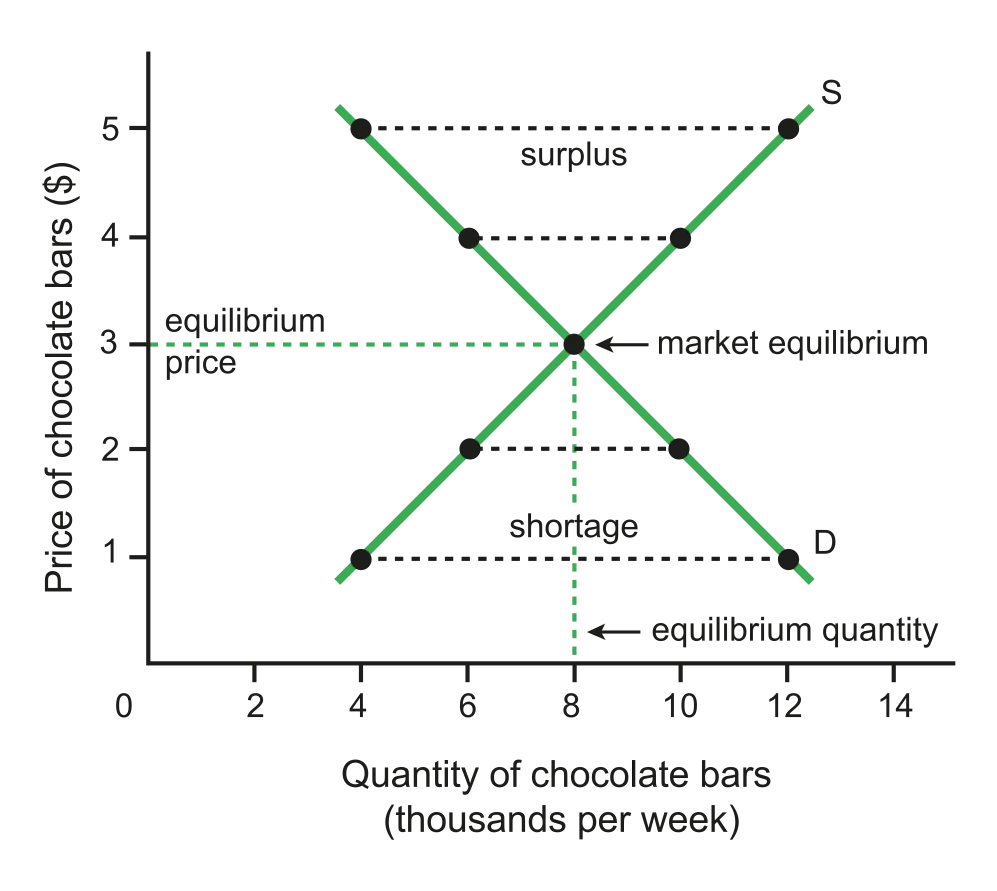
Figure 2.3.1 Market equilibrium
•
Market equilibrium: a position where the forces of D and S are in balance, and there is no tendency for P to change.
◦
In the diagram, market equilibrium is where D and S curves cross each other, determining equilibrium P ($3) and equilibrium Q (8000/week).
•
At every P other than equilibrium price ($3), Pe, there is market disequilibrium.
◦
If P>Pe → excess supply = surplus → Q demanded < Q supplied.
◦
If P<P3 → excess demand = shortage → Q supplied < Q demanded.
•
If there is a surplus, excess supply will ensure that P will decrease to Pe.
◦
Qd would increase while Qs would decrease, eliminating the surplus.
•
If there is a shortage, excess demand will ensure that P will increase to Pe.
◦
Qd would decrease while Qs would increase, eliminating the shortage.
Shifting the demand curve to produce a new market equilibrium
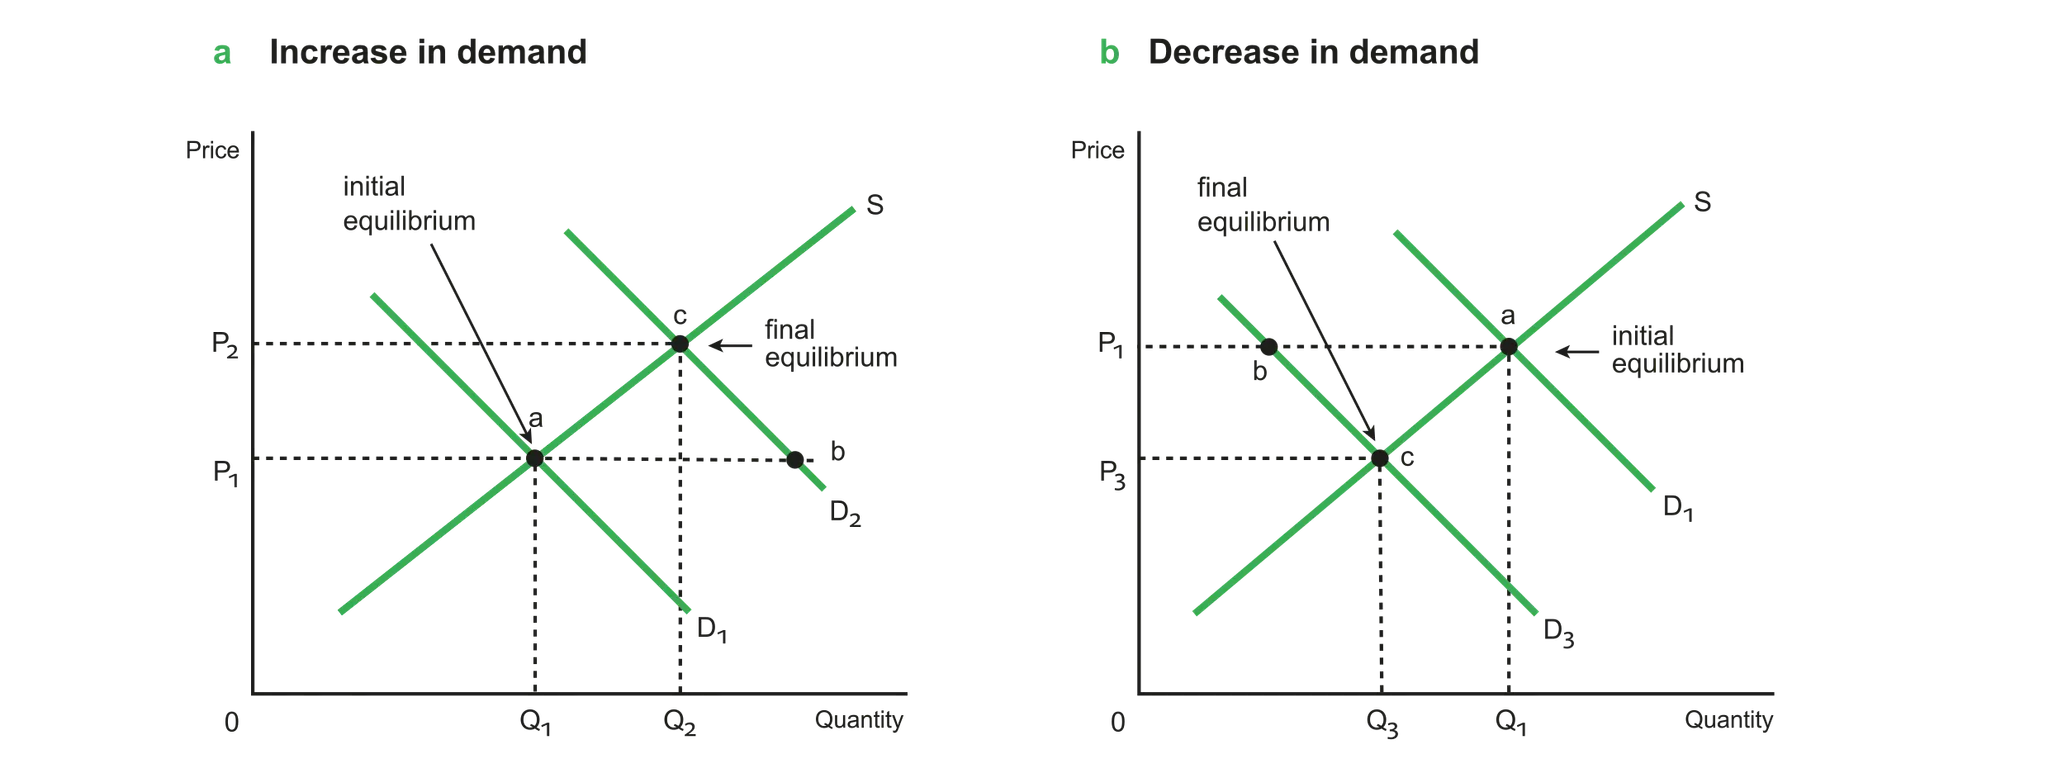
Figure 2.3.2 Changes in demand and the new equilibrium price and quantity
•
Suppose that D increases from D1 to D2 due to a change in non-price determinant (e.g. increase in consumer income). At the initial price, P1, there is a movement to point B, which results in excess demand. A shortage exerts an upward pressure on P from P1 to P2, causing a movement to point C.
◦
Disequilibrium (shortage) is eliminated and a new equilibrium (point C) is reached.
Thus,
•
As D increases from D1 to D2, Pe increases and Qe increases.
•
As D decreases from D1 to D3, Pe decreases and Qe decreases.
Shifting the supply curve to produce a new market equilibrium
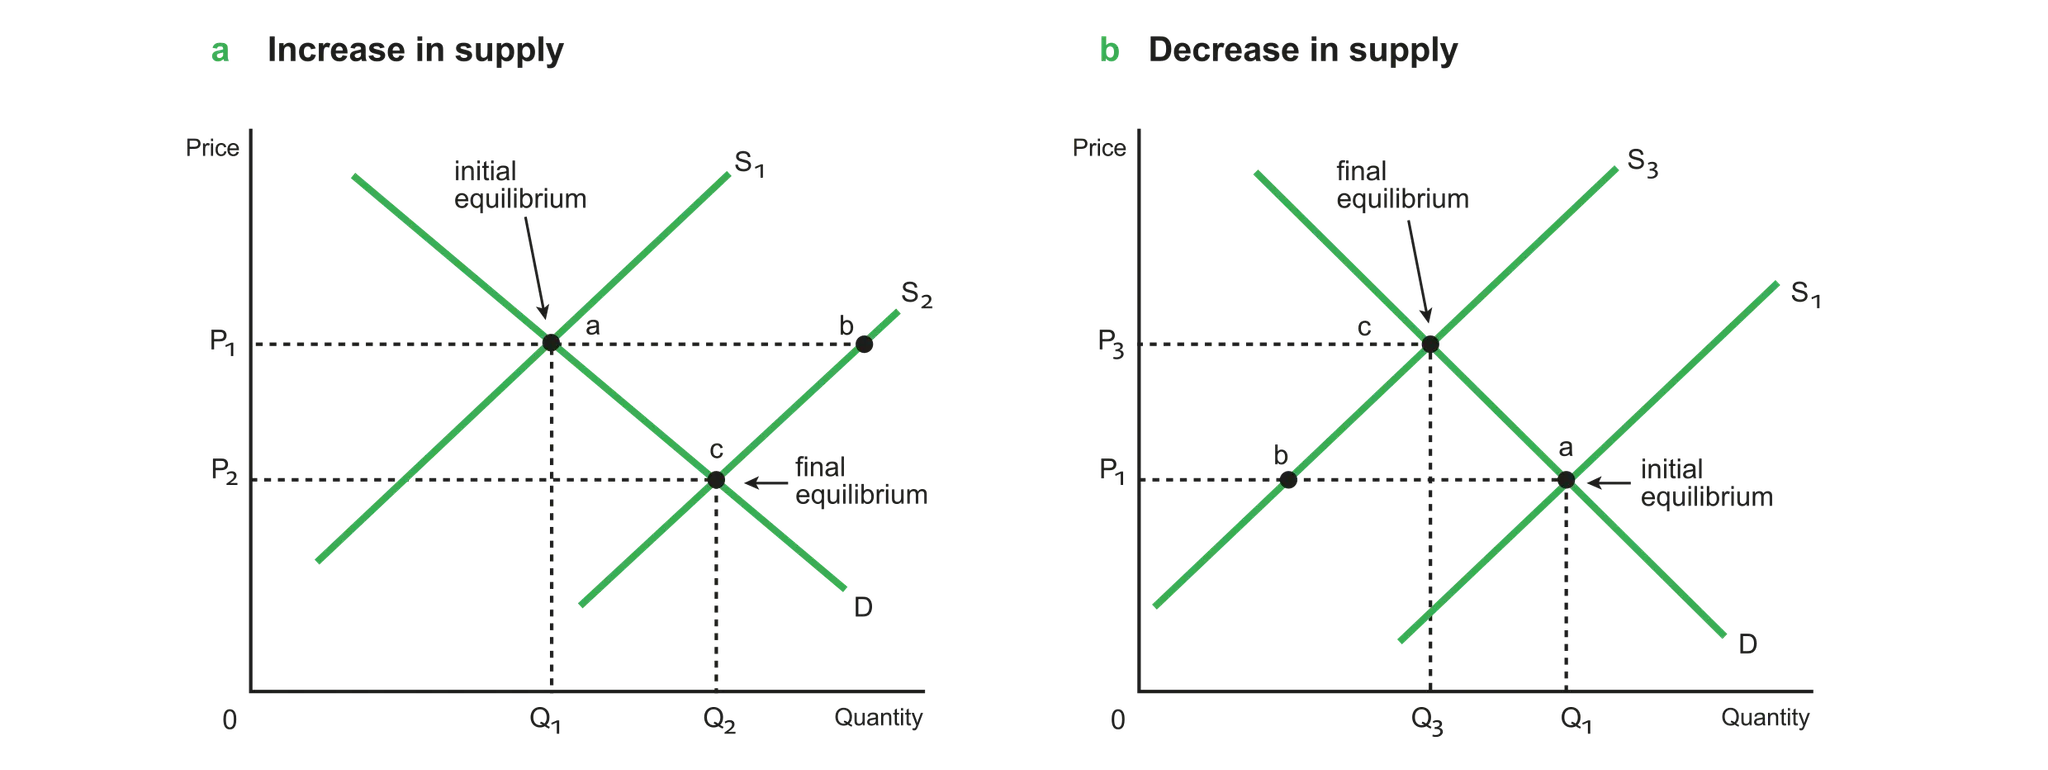
Figure 2.3.3 Changes in supply and the new equilibrium price and quantity
•
Suppose that S increases from S1 to S2 due to a change in non-price determinant (e.g. decrease in cost of production). At the initial price, P1, there is a movement to point B, which results in excess supply. A surplus exerts a downward pressure on P from P1 to P2, causing a movement to point C.
◦
Disequilibrium (surplus) is eliminated and a new equilibrium (point C) is reached.
Thus,
•
As S increases from S1 to S2, Pe falls while Qe increases.
•
As S decreases from S1 to S3, Pe increases and Qe falls.
Functions of the price mechanism
•
Price mechanism: Is a system that results from the interaction between demand and supply, determining prices that allocate scarce resources among competing wants and needs.
1.
Prices as signals and incentives and the allocation of resources
•
Resource allocation: assigning specific resources to the production of specific goods and services.
◦
As resources are scarce (= limited in quantity in relation to people’s needs and wants for them) therefore societies must make choices on how to best allocate resources to avoid resource waste.
◦
Every choice involves an opportunity cost (= the value of the next best alternative forgone).
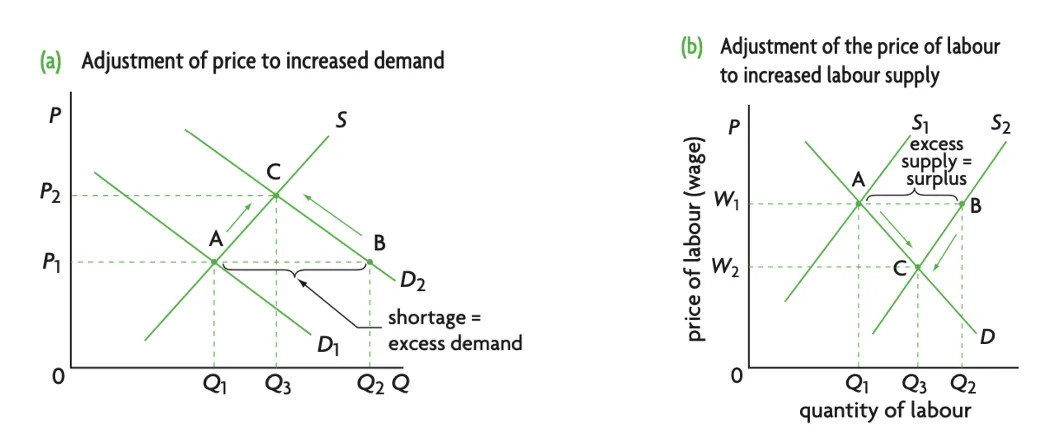
Figure 2.3.4 Adjustment of price to increased demand
•
Suppose that D increases from D1 to D2. At the initial price, P1, there is excess demand (Q2-Q1).
→P begins to increase from P1 to P2, acting as:
1.
a signal to producers and consumers that there is a shortage; i.e. the rising P informs the consumers that the good is now more expensive while informing the producers that the production of a good is now more profitable.
2.
(a) an incentive to producers to produce more Q, leading to an upward movement along the S curve (Qs increases) because of firms’ greater willingness and ability to produce as P increases.
(b) an incentive to consumers to buy less Q than Q2, leading to an upward movement along the D2 curve (Qd decreases) because of consumers’ lower willingness and ability to buy as P increases.
•
The new market equilibrium sets at point C with price P2 and quantity Q3.
•
Resource allocation has occurred, as some resources were taken out of the production of other goods and brought into the production of this good.
Consumer and Producer surplus
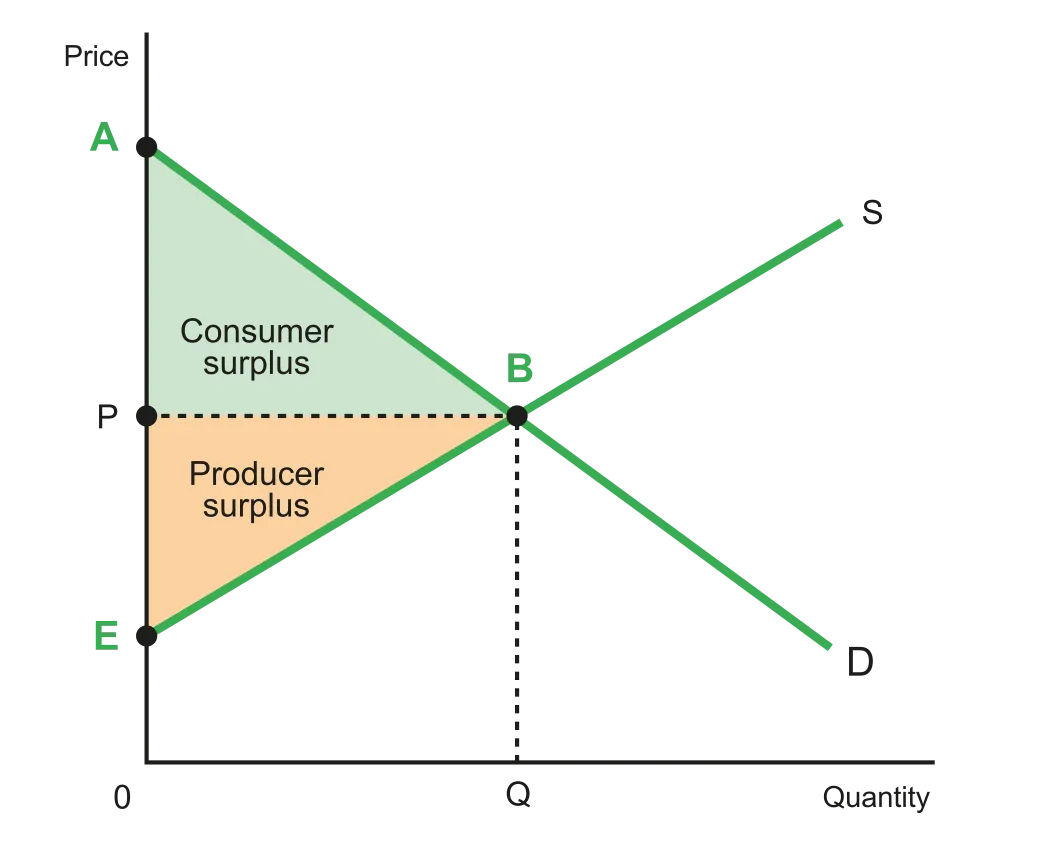
Figure 2.3.5 Consumer and producer surplus
•
Consumer surplus: the benefit received by consumers who buy a good at a lower P than the P they are willing to pay.
◦
The area under the D curve up to the equilibrium P (=Pe), represented by the green area.
•
Producer surplus: the benefit received by producers who sell a good at a higher P than they are willing to receive.
◦
The area above the S curve up to the equilibrium P (=Pe), represented by the orange area.
Calculating Consumer & Producer Surplus from a Diagram
Producer and consumer surplus can be calculated from a diagram using a standard formula for calculating the area of a triangle
Social/Community Surplus
•
Social surplus: the sum of producer and consumer surplus.
•
In a free competitive market, the social surplus is maximised.
Allocative efficiency at the competitive market equilibrium
•
Allocative Efficiency (=Economic efficiency): Equilibrium is achieved when marginal utility (marginal benefit) equals marginal cost (MB = MC).Resources are allocated optimally, maximising benefit for both consumers and producers.
•
At equilibrium B in the diagram, there is allocative efficiency because:
◦
Social/community surplus is maximum at equilibrium.
◦
Marginal Benefit = Marginal Cost.
•
Productive Efficiency: Occurs at the level of output where average costs are minimised
◦
There is no wastage of scarce resources and a high level of factor productivity