

Measuring economic inequality
Economic inequality:
unequal distribution of income and wealth.
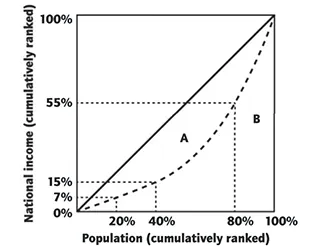
Figure 3.4.1 Lorenz curve
•
The poorest 20% of people receives only 7% of national income.
•
Diagonal line: line of perfect income equality (i.e. poorest 20% earns 20% of income and the poorest 40% earns 40% of income).
•
As we move further to the right of the diagonal, the distribution of income becomes more and more unequal.
Gini coefficient: ratio of the area between the Lorenz curve and the diagonal over the area of the half-square.
Gini coefficient = Area (A)Area (A+B)
•
Varies from 0 to 1.
•
0 = society where everyone has the same income = no inequality.
•
1 = society where only 1 person has all the income = maximum inequality.
Defining poverty
Absolute poverty: situation where a household’s income is less than $1.25 a day.
•
Household’s income is insufficient to purchase the minimum bundle of goods and services needed for survival.
Relative poverty: household’s income is below 50% of the median household income.
•
Exists in all countries.
Measuring poverty
International poverty lines. | Minimum income standards. | Composite indicators.
• Multidimensional Poverty Index (MPI). |
Causes of economic inequality and poverty
Inequality of opportunity | Different levels of human capital | Discrimination |
Parental background, gender, place of birth.
• Determine the educational qualifications they obtain → type of job they get → level of income. | Human capital: skills, education, experience in the labour force.
• Some workers receive higher wages - special skills, education, and experience.
• Differing working conditions, and job stability. | Gender, race, religion.
• Groups facing discrimination face difficulty in finding a job. |
Impact of income and wealth inequality
Impact on economic growth | Impact on standards of living and social stability |
High inequality → high income individuals spend their income on luxuries → their saving is low → low investment → lower economic growth. | Inequality → disadvantaged people commit and be victims of crimes → reduce people’s well-being. |
The role of taxation
Progressive tax | Proportional tax | Regressive tax |
Higher income individuals pay proportionately more.
• Income increase → % of income paid as tax increase. | Higher income individuals pay proportionately the same.
• Income increase → % of income paid as tax remains constant. | Higher income individuals pay proportionately less.
• Income increase → % of income paid as tax decrease. |
Average and marginal tax rates
Average tax rate (ATR):
Marginal tax rate (MTR):
•
Progressive tax: income ↑ → ATR increase → MTR > ATR
•
Proportional tax: income ↑ → ATR remains constant → MTR = ATR
•
Regressive tax: income ↑ → ATR decrease → MTR < ATR
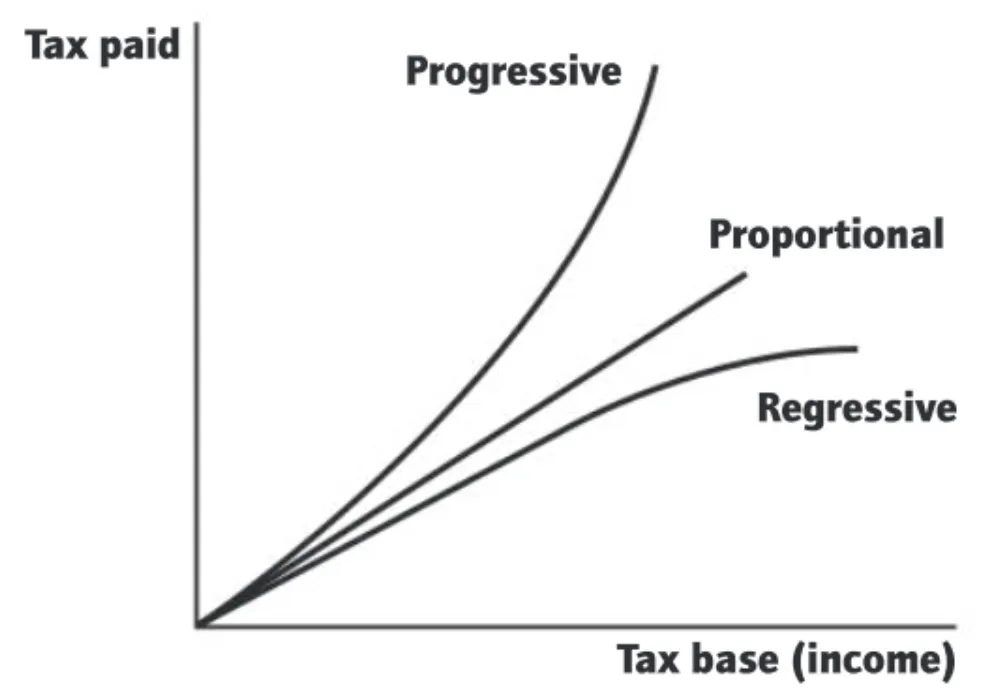
Figure 3.4.2 Types of taxation
Further policies to reduce poverty, income and wealth inequality
Investment in human capital | Transfer payments | Universal basic income (UBI) | Minimum wage policy |
Reduce inequalities of opportunities.
• Access to education, and health services → labour productivity ↑
• Decrease income and wealth inequality. | Pensions, unemployment benefits.
• Decrease income inequality. | Provides all citizens with a given sum of money (regardless of their income, or wealth…). | Increases minimum wage.
• Supports the incomes of low skilled workers. |