

How to measure economic activity
Gross Domestic Product (GDP)
: the value of all final goods and services produced within an economy over a period of time, usually a year or a quarter.
Output approach | Expenditure approach | Income approach |
adds up the value of all the final goods and services produced by each economic sector | adds up the total amount spent on domestically produced final goods and services | adds up all the income generated in the production process and by the factors of production in the economy |
GDP = sector 1 + sector 2 + sector 3 + … + sector n | GDP = C + I + G + (X-M)
• C = consumption spending
• I = investment spending
• G = government spending
• X-M = net export | GDP = rent + wage + interest + profit |
•
Gross National Income (GNI):
•
GDP or GNI per capita:
◦
Measures standard of living of a country.
•
Real GDP or GNI per capita at purchasing power parity (PPP): converts each country’s per capita income figure to a common currency.
Real vs Nominal:
Real GDP | Nominal GDP |
Nominal GDP adjusted for inflation | Measures economic activity in monetary terms, at current prices. |
GDP deflator: comprehensive price index that measures the average level of prices of all goods and services included in the GDP of a country.
What do all these national income statistics tell us?
•
Provide a measure of the size of an economy.
•
Assess the performance of an economy over time.
•
Help policymakers evaluate appropriate policies.
•
Measure the standard of living in a country.
Using GDP or GNI statistics to measure economic well being
GDP
Focus on output produced outside of the country.
GNI
Focus on incomes earned by people who are living in the country.
Adjust to the size of the country.
Doesn’t provide information about the country’s income distribution.
Might imply environmental damage due to rising production levels.
Doesn’t consider the value of leisure.
Alternative measures to measure economic well being
Better life index (BLI) | Happiness index | Happy planet index |
Includes 11 topics that are related to material living conditions and quality of life. e.g., housing, income, education, life satisfaction | Ranks countries by how happy their citizens perceive themselves to be. | Assesses whether a country is able to promote the well-being of its residents. |
The business cycle
Business cycle: short-term fluctuations of an economy’s real GDP over time.
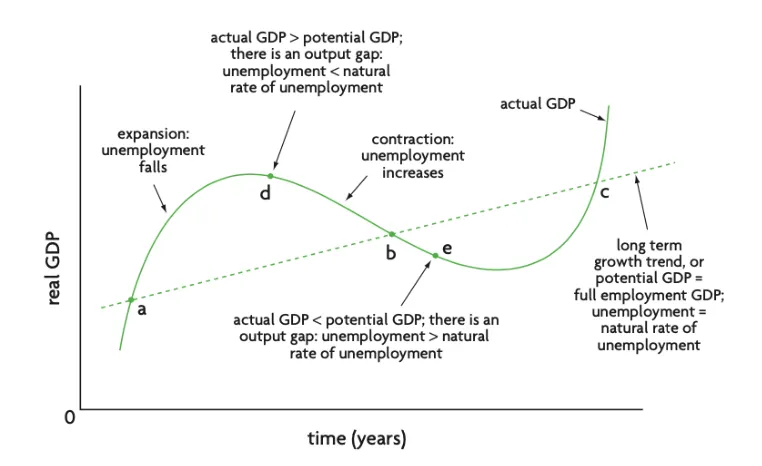
Figure 3.1.1 The business cycle
•
t1~t2: economy is contracting - real GDP is decreasing → recession.
◦
Recession: real GDP decreases for at least 2 consecutive quarters.
•
t2: trough - minimum level of real GDP
•
t2~t3: economy is growing - real GDP is increasing → expansion phase.
◦
Expansion phase might involve inflationary pressure.
•
T3: peak - maximum real GDP
The Characteristics of a Boom and Recession
Recession | Boom |
• Two or more consecutive quarters of negative economic growth.
• Increasing/high rates of unemployment.
• Decreasing confidence for firms/households.
• Low inflation. Increasing negative output gap and spare production capacity.
• Increase in government expenditure, potentially leading to a great budget deficit. | • Increasing/high rates of economic growth.
• Decreasing unemployment and increasing job vacancies.
• High confidence and more risky decisions taken.
• Increasing rate of inflation - usually demand pull.
• Reduction of negative output gap or creation of a positive gap. Spare capacity is reduced or eliminated.
• Improvement in the government budget as tax revenues rise and expenditure falls. |