

International trade: exchange of goods and services between countries.
•
Mechanism: It involves both exports (selling domestically produced goods and services to foreign markets) and imports (buying goods and services produced in foreign markets).
•
Freedom: International trade is considered "free" when there is no government intervention such as quotas, tariffs, or other restrictions imposed to reduce or limit trade.
Benefits of free trade
The benefits of free trade can be seen for a country where the world price for a good/service is above the domestic price thus allowing for exports
To consumers
•
Lower prices
◦
Consumers can buy goods and services below the domestic price level.
◦
Free trade allows countries that produce goods at a high unit cost to discontinue producing these goods and import them.
◦
Countries can concentrate on the goods they produce relatively cheaply.
•
Greater choice
◦
Citizens have access to goods produced by other countries → increase their choice.
•
Increased competition
◦
Domestic firms have to compete with firms from other countries.
◦
Competition forces firms to keep costs low and to innovate.
To firms
•
Economies of scale due to access to larger markets
◦
Free trade allows firms to increase the amount they produce and therefore gain greater economies of scale.
◦
Firms can benefit from the decreased unit cost by increasing their profit or reducing their price to the consumer.
•
Access to different resources
◦
Free trade allows a firm to gain access to resources they don’t have.
To the economy
•
Increased economic efficiency
◦
Increase in economic welfare: countries produce the goods and services they are most suited to.
◦
Trade enables countries to specialise: theory of comparative advantage.
•
Source of foreign exchange
◦
To buy imports, foreign exchange is needed - exports generate this.
•
Trade enables the flow of new ideas and technology
◦
Enable new ideas and new technologies and skills to be transferred from one country to another.
•
Trade makes countries interdependent → reduces hostility and violence.
◦
Form the basis for economic relationships → reduce the possibility of war or other hostilities.
Using diagrams to illustrate free trade
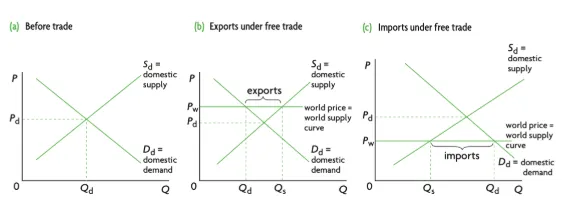
Figure 4.1.3 Using diagrams to illustrate international trade
Diagram Analysis:
1.
Before Trade
•
A Domestic market equilibrium without international trade.
•
Determines bindles' equilibrium price and quantity under no trade.
•
Raises the question of whether bindles should be imported or exported.
•
Depends on domestic bindle price versus international market price.
2.
Exports under free trade
•
Illustrates the country opening to international trade.
•
World price (Pw) is higher than domestic price (Pd).
•
The country’s exports bind due to higher world prices.
•
Excess quantity supplied (Qs - Qd) available for export.
•
Reflects comparative advantage principle.
3.
Imports under free trade
•
Depicts world bindle price (Pw) lower than domestic price (Pd).
•
The country imports due to lower world prices.
•
Excess quantity demanded (Qd - Qs) to be imported.
•
Demonstrates reliance on more efficient producers abroad.
•
Highlights comparative disadvantage principle.
Absolute and comparative advantage (HL only)
Absolute advantage (HL only)
Absolute advantage: occurs when a country is able to produce a product using fewer factors of production than another country
•
A country may well have absolute advantage but still not have comparative advantage
◦
It should produce goods/services in which it has comparative advantage
Production possibility curves showing absolute advantage
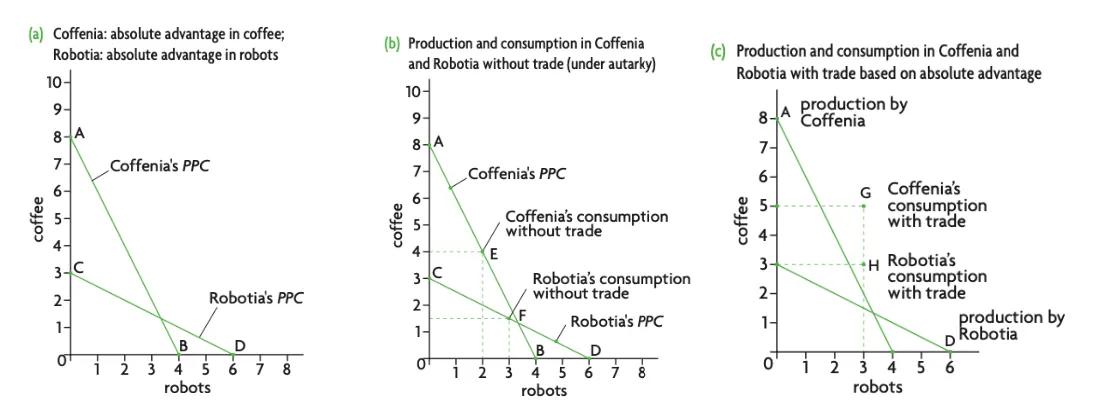
Figure 4.1.4 Using diagrams to illustrate international trade
Diagram analysis
(a) Specialise and Trade
•
Coffenia specialises in coffee, Robot in robots.
•
Coffenia produces 8 units of coffee (Point A).
•
Robotia produces 6 robots (Point D).
•
Total production increases to 8 units of coffee and 6 robots.
•
Coffenia exports 3 units of coffee, Robotia exports 3 robots.
(b) No Trade
•
Coffenia and Robotia produce along their PPCs.
•
Each country allocates resources between coffee and robots.
•
Represents self-sufficiency without trade.
•
Coffenia produces 4 units of coffee and 2 robots (Point E).
•
Robotia produces 1.5 units of coffee and 3 robots (Point F).
•
Total production: 5.5 units of coffee and 5 robots.
(c) Trade at 1:1 Price Ratio
•
Coffenia and Robotia trade 3 units of coffee for 3 robots.
•
Coffenia consumes 5 units of coffee and 3 robots.
•
Robotia consumes 3 units of coffee and 3 robots.
•
Both countries consume beyond their PPCs.
•
Specialisation according to absolute advantage leads to global resource reallocation.
Comparative advantage (HL only)
Comparative advantage: a country should specialise in the goods/services that it can produce at the lowest opportunity cost. can produce a good at a lower opportunity cost than its trading partner.
Sources of comparative advantage
Natural Resources
•
Abundant natural resources like minerals, energy sources, or fertile land give countries a comparative advantage.
•
For instance, Ukraine's fertile land and suitable climate foster grain production.
Labor Force
•
Skilled, cost-effective labour can provide a competitive edge.
•
Countries with skilled workers in sectors like technology or manufacturing may excel.
•
Lower labour costs may favour labour-intensive industries.
Technology
•
Access to advanced technology fosters innovation and a comparative advantage.
Capital and Infrastructure
•
Quality infrastructure, including transportation and communication systems, aids efficiency and connectivity.
•
Developed infrastructure facilitates production, distribution, and trade.
Economies of Scale
•
Achieving economies of scale reduces costs per unit, enhancing competitiveness.
Government Policies and Support
•
Government policies like trade agreements, subsidies, or tax incentives shape a country's comparative advantage.
•
Strategic support helps industries develop and compete globally. Factor endowments: differences in the stock of natural capital and its productivity.
•
Differences in technology.
Theory of comparative advantage
Countries will find it mutually advantageous to trade if the opportunity cost of production of goods differs.
•
Countries can gain from specialisation and trade even if one country has an absolute advantage in both goods.

Figure 4.1.5 Comparative Advantages
Diagram Analysis
Production Possibilities:
•
Cottonia: 20 units of cotton or 10 units of microchips per day (per worker)
•
Microchippia: 25 units of cotton or 50 units of microchips per day (per worker)
Absolute Advantage:
•
Microchippia has an absolute advantage in both goods.
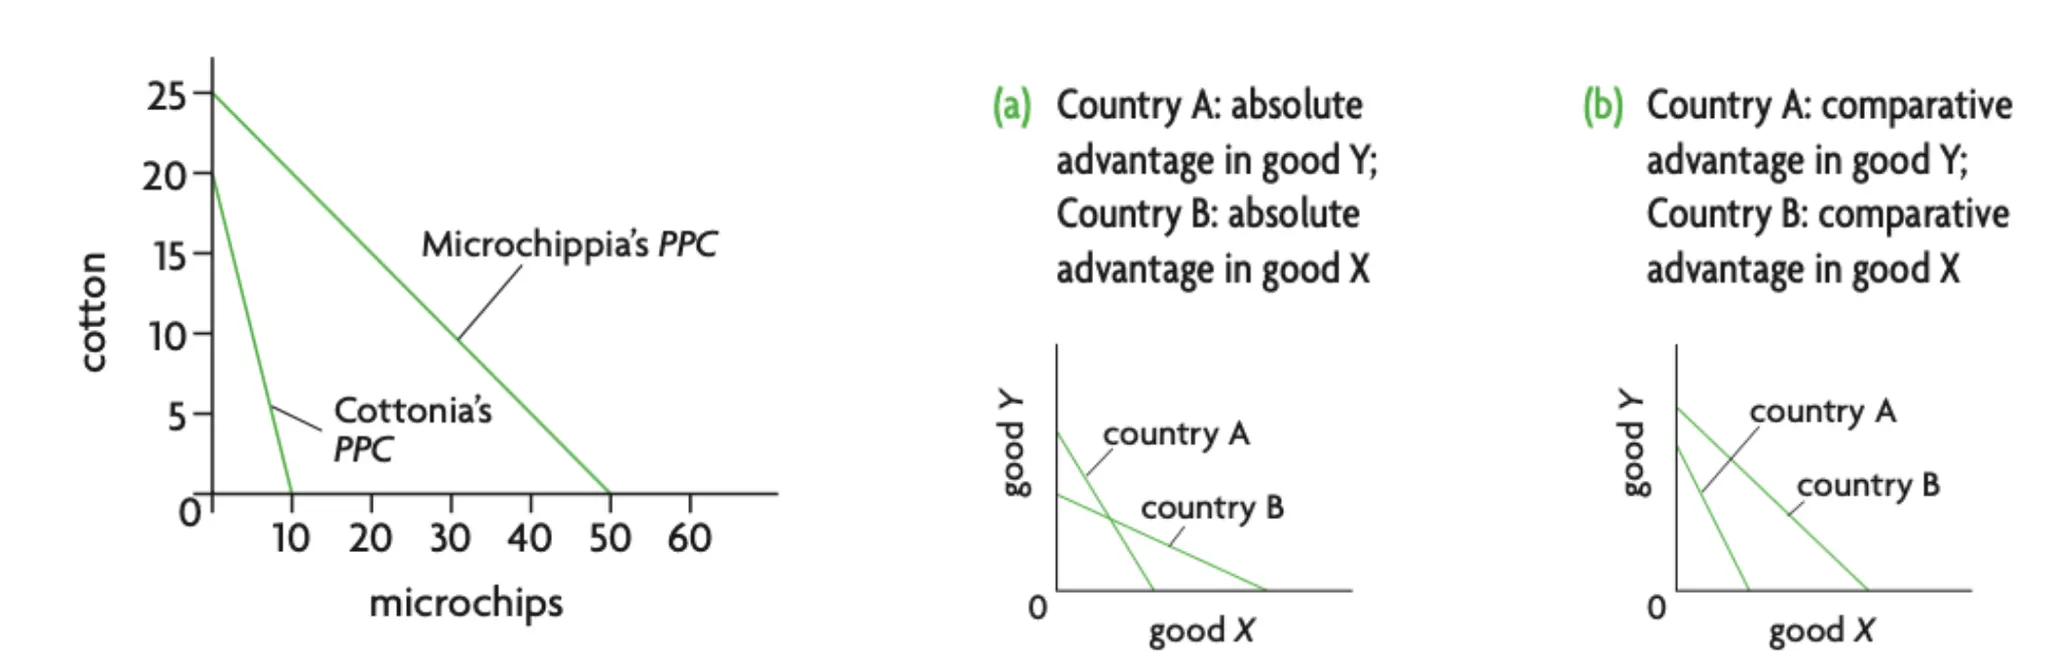
Figure 4.1.6 Absolute and Comparative Advantage
Diagram Analysis
PPC Comparison:
•
Microchippia’s PPC lies entirely above Cottonia’s PPC.
◦
Microchippia’s absolute advantage in both cotton and microchips.
Determining Comparative Advantage:
•
Flatter PPC: Comparative advantage in the horizontal axis is good.
◦
Microchippia (flatter PPC): Comparative advantage in microchips.
•
Steeper PPC: Comparative advantage in the vertical axis good.
◦
Cottonia (steeper PPC): Comparative advantage in cotton.
Intersecting PPCs:
•
If PPCs intersect, each country has an absolute advantage in one good.
Limitations to the theory of comparative advantage
•
It is based on assumptions.
◦
No transport costs: transport costs for imports and exports change relative prices → limitinglimit the benefits of specialisation.
◦
Costs are constant: no economies of scale.
◦
Goods are homogenous (identical).
◦
No tariffs / trade barriers.
◦
Fixed factors of production: in reality, enterprise and capital are mobile.
•
Specialisation may not allow structural changes in a developing country.
◦
Many developing countries have a comparative advantage in agricultural goods → might stop them from developing their secondary sector.
•
Comparative advantage may lead to excessive specialisation → country might be vulnerable.
Over-dependence
•
Specialisation leads to reliance on other countries, creating vulnerability (e.g., dependence on Russian gas).
Environmental Damage
•
Explanation: Ignores negative externalities, worsening quality of life in affected areas.
Income Distribution
•
GDP per capita may rise, but wealth is unevenly distributed, benefiting the wealthy more.
Structural Unemployment
•
Specialisation can shut down industries, leading to unemployment for workers who can't easily transition to new jobs.
Flawed Assumptions
•
Zero transport costs: Unrealistic, as moving goods/services incurs costs.
•
Perfect knowledge: Assumes awareness of all comparative advantages, which is rare.
•
Easy factor substitution: Assumes quick switches between capital and labour, which is idealistic.
•
Constant production costs: Ignores economies of scale that reduce costs with increased output.