

Market Structures
Market structures refer to the characteristics of the market in which firms or industries operate. These include:
•
Number of Buyers: The quantity of consumers purchasing goods/services.
•
Number and Size of Firms: The quantity and scale of businesses operating in the market.
•
Type of Product: Whether products are homogenous (identical) or differentiated.
•
Barriers to Entry and Exit: Obstacles hindering or facilitating new firms entering or leaving the market.
•
Degree of Competition: The level of rivalry between firms.
Types of Market Structures
1.
Perfect Competition: A theoretical market structure with many buyers and sellers offering homogenous products, no barriers to entry/exit, and perfect information.
2.
Imperfect Competition: Market structures deviating from perfect competition, including:
•
Monopolistic Competition: Many firms with differentiated products (e.g., nail salons).
•
Oligopoly: A few large firms dominate, each with significant market power.
•
Monopoly: A single firm controls the entire market, influencing supply and prices.
Market Failure and Abuse of Market Power
Market failure can result from the abuse of market power, which is characterised by:
•
Control of Prices: Suppliers having the ability to set and control prices in the market.
•
Output Restriction: Suppliers limiting output to artificially raise prices.
•
Lack of Allocative Efficiency: Resources not allocated to their most valued uses.
•
Lack of Productive Efficiency: Production not occurring at the lowest possible cost.
Government Intervention
Governments often intervene to prevent or reduce market power abuse through:
•
Antitrust Laws: Regulations aimed at preventing monopolies or reducing market concentration.
•
Competition Policy: Measures to promote competition and prevent anti-competitive behaviour.
Market Power: Ability of a firm to influence market conditions, affecting prices, output, and other market variables.
•
Indicators: Market share, concentration ratios, and barriers to entry are used to measure market power.
•
Effects: Allows firms to set prices above competitive levels or restrict output, leading to market distortions and potential inefficiencies.
Market Power & Perfect Competition
Firms in perfect competition have low market power, low market share and a low industry concentration ratio
•
Market Failure: Minimal, as competition ensures efficient resource allocation.
•
Government Intervention: Aimed at encouraging more competition in every sector of the economy.
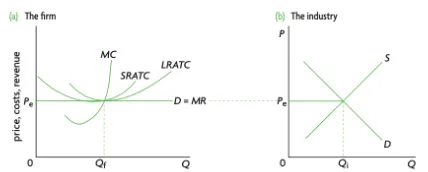
Fig 2.11.1 The firm and industry long-run equilibrium position in perfect competition
Diagrammatic Representation of Perfect Competition
•
Firms in perfect competition maximise profit by producing at the point where marginal cost equals marginal revenue (MC=MR).
•
These firms lack market power and cannot influence price or quantity.
•
Due to a large number of sellers, they are price takers.
•
The firm's selling price is the same as the market price (P1 = MR = AR = Demand).
•
S/R = Profit loss or Abnormal profit
•
However, L/R equilibrium = make normal profit
Abnormal Profit in Perfect Competition in the Short-run
•
The firm produces at the profit maximising level where MC=MR (Q1).
•
At this point, Average Revenue (AR) or price (P1) exceeds Average Cost (AC) or cost per unit (C1).
•
The firm earns abnormal profit, calculated as (P1 - C1) x Q1.
Moving from Abnormal Profit in the Short-run to Normal Profit in the Long-run
•
In perfect competition, firms making abnormal profit in the short-run attract new entrants to the industry.
•
New entrants are enticed by the chance to earn supernormal profit.
•
There are no barriers to entry, making it easy for new firms to join the industry.
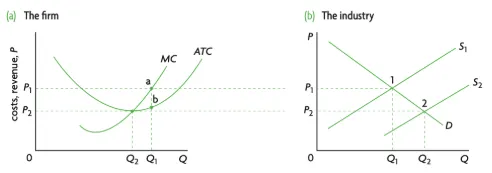
Fig 2.11.2 From short-run abnormal profit to long-run normal profit
Diagram Analysis
•
Initially, the firm produces at the profit-maximising level (Q1) where MC=MR, earning abnormal profit as AR (P1) exceeds AC (P2).
•
New entrants are attracted, increasing industry supply from S1 to S2, leading to an increase in overall quantity (Q1 to Q2) and a decrease in price (P1 to P2).
•
The firm now sells at the industry price (P2), reducing its market share, resulting in a decrease in output from Q1 to Q2.
•
At the new profit-maximising level (MC=MR), the firm earns only normal profit, as AR equals AC.
•
In the long-run, firms in perfect competition make normal profit, with firms making a loss exiting the industry and those making abnormal profit being gradually eliminated as new firms enter.
Losses in Perfect Competition in the Short-run
•
At this output level, Average Revenue (AR) or price (P1) is less than Average Cost (AC) or cost per unit (C1).
•
The firm incurs a loss, calculated as (P1 - C1) x Q1.
Moving from Loss in the Short-run to Normal Profit in the Long-run
•
If firms make losses in the short-run, some will shut down.
•
The shut-down rule determines which firms shut down; they will cease production if they cannot cover variable costs.
•
There are no barriers to exit, making it easy for firms to leave the industry if they cannot cover their costs.
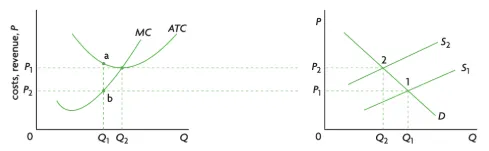
Fig 2.11.2 From short-run loss to long-run normal profit
Diagram Analysis
•
Initially, the firm produces at the profit-maximising level (Q1) where MC=MR, but incurs a loss as AR (P1) is less than AC (C1).
•
Some firms exit the industry, decreasing industry supply from S1 to S2, leading to a decrease in overall quantity (Q1 to Q2) and an increase in price (P1 to P2).
•
The firm now sells at the industry price (P2), increasing its market share due to fewer competitors, resulting in an increase in output from Q1 to Q2.
•
At the new profit-maximizing level (MC=MR), the firm earns normal profit, as AR equals AC.
•
In the long-run, firms in perfect competition make normal profit, with firms making a loss leaving the industry and those making supernormal profit being gradually eliminated as new firms enter.
Efficiency in Perfect Competition
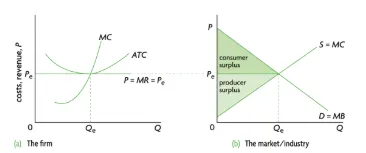
Figure 2.11.3 Productive and allocative efficiency in perfect competition in the long run
•
Allocative Efficiency: Occurs when average revenue (AR) equals marginal cost (MC). Resources are allocated to produce the quantity where consumers and producers receive the maximum benefit. No one can be made better off without making someone else worse off, and there is no excess demand or supply.
•
Productive Efficiency: Occurs when marginal cost (MC) equals average cost (AC). At this point, average costs are minimised, and there is no wastage of scarce resources. Factor productivity is high, indicating optimal utilisation of inputs.
Market Power & Monopolies
Market power refers to a firm's ability to influence and control market conditions, significantly impacting price, output, and other market variables.
•
Market Power:
◦
High market power, high/total market share, and high/perfect industry concentration ratio.
◦
Significant market failure in monopoly firms.
◦
Governments regulate mergers and acquisitions to prevent any single firm from gaining more than 25% market share in many economies.
Characteristics of Monopoly Markets
•
Single Seller: Only one seller in the market.
•
No Substitutes: No substitute products available.
•
Complete Market Power: Firm can set prices and control output.
•
Supernormal Profit: Ability to maximise supernormal profit in the short run without erosion in the long run due to high barriers to entry.
•
Barriers to Entry:
◦
High barriers prevent competition.
◦
Monopolies can prevent competition by purchasing potential threats.
A Monopoly Making Abnormal Profits
•
As a single seller, the firm in a monopoly market is the entire market.
•
There is no differentiation between the firm and the industry.
•
It is a price maker, with downward sloping revenue curves.
•
To maximise profits, the firm produces where marginal cost (MC) equals marginal revenue (MR).
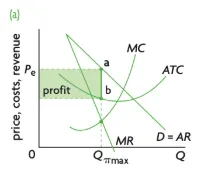
Figure 2.11.4 Monopoly making abnormal profit in S/R
Diagram analysis
•
The firm produces at the profit maximising level where MC = MR (Q1).
•
At this level, AR > AC .
Monopoly Making Normal Profits
Normal profit is the minimum profit needed to keep the monopolist in the market in the long run.
•
Opportunity Cost: Covers the opportunity cost of the resources used.
•
Revenue and Costs: Total revenue (TR) equals total cost (TC), including explicit and implicit costs.
•
No Abnormal Profit: Indicates the monopolist is not earning abnormal profit.
•
Competitive Return: The monopolist is earning just enough to cover production costs and earn a competitive return.
A Monopoly Making Losses in the Short-Run
•
Loss Minimization: The monopolist incurs losses but aims to minimise them in the short run.
•
Conditions: Occurs when the market price (AR) is below the average total cost (ATC) but above the marginal cost (MC) of production.
•
Long-Run Implications: The monopolist cannot sustain losses indefinitely.
•
Possible Actions: If losses persist, the monopolist might exit the market or change production strategies.
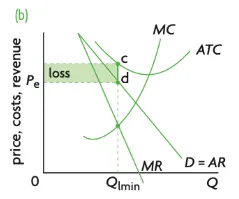
Figure 2.11.5 Monopoly making abnormal profit in S/R
Diagram Analysis
•
The firm produces at the profit maximising level of output where MC = MR (Qlmin).
•
At this level, AR < ATC.
Side by Side Comparison of Perfect Competition & Monopoly
Perfect competition tends to achieve both productive and allocative efficiency due to the presence of competition, whereas monopolies generally result in inefficiencies in both aspects
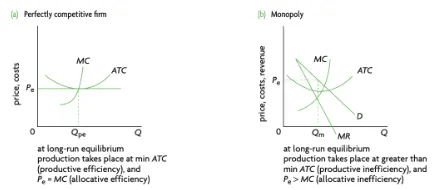
Figure 2.11.6 Allocative and productive inefficiency in perfect competition and monopoly
Diagram Analysis
Perfect Competition:
•
Profit maximisation level at MC=MR.
•
Productively efficient: MC=AC at this output level.
•
Allocatively efficient: AR (P)=MC, no welfare loss.
Monopoly Market :
•
Profit maximisation level at MC=MR.
•
Not productively efficient: AC > MC at this output level.
•
Productive efficiency at where MC=AC.
•
Not allocatively efficient: AR (P) > MC at this output level.
•
Allocative efficiency at AR=MC (point F).
•
DWL created
Costs & Benefits of a Monopoly Market Structure
Government Regulator Intervention:
•
Instances where regulators act to decrease monopoly power.
•
Firms may challenge regulators in court, arguing that their market power benefits consumers.
•
Theoretical possibility, but profit maximisation often prevents it.
Advantages & Disadvantages of Monopoly Power
Stakeholders | Advantages | Disadvantages |
The Firm | • Abnormal profits for investment • Increased global competitiveness.
• Economies of scale lower average cost.
• Producer surplus increases. | • Reduced incentive for efficiency.
• Cross-subsidization inefficiencies.
• Misallocation of resources (P > MC)
• Innovation effectiveness may decrease. |
Employees | • Higher wages from abnormal profits. | • Having only one supplier in the industry limits the opportunity to change employers |
Consumers | • Better-quality products from innovation.
• Cross-subsidization can lower prices.
• Prices may fall due to economies of scale. | • Higher prices due to lack of competition.
• Less innovation and product quality over time.
• Possible decline in customer service. |
Suppliers | • Increased sales volume.
• Less competition, but monopsony power. | • Dictated prices may not be profitable. |
Natural Monopoly
Occurs when the most efficient number of firms in the industry is one.
Causes:
•
Infrastructure issues, such as utility services delivery where multiple pipelines are not feasible.
•
Significant entry costs, including sunk costs.
•
Economies of scale leading to lower prices for consumers.
•
Examples: Common in utility industries like water delivery.
•
Regulation: Typically regulated by the government to prevent monopoly pricing.
•
Regulatory Measures: Often involves setting maximum prices to protect consumers.
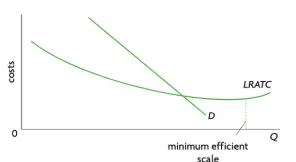
Figure 2.11.7 Natural Monopoly
Factors of Natural Monopoly
Costs and Market Demand:
•
LRATC curve still declining at intersection with market demand (D), indicating economies of scale not yet exhausted.
•
Minimum efficient scale occurs at higher output level, where lowest average total costs are achieved.
Cost Dynamics:
•
Average costs continue to fall beyond the point where market demand is satisfied.
•
Falling average costs persist over a large output range due to massive capital costs (e.g., infrastructure development).
Barrier to Entry:
•
Natural monopoly deters new entrants due to difficulty in achieving low costs of existing firms.
Examples:
•
Water, gas, electricity distribution, cable television, fire protection, postal services.
Technological Change:
•
Changing technologies can disrupt natural monopoly conditions.
•
New entrants able to produce at lower costs may erode monopoly status.
◦
Telecommunications industry saw new entrants challenging traditional telephone companies.
Monopolistic Competition
Firms in monopolistic competition have some market power, a slightly higher market share than perfect competition and a low industry concentration ratio
•
A monopolistic market structure is one in which there are many firms offering a similar product but with some product differentiation
◦
Nail salons
◦
Hairdressing or barber shops
◦
Massage parlours
◦
Fruit and veg stores
Characteristics | Explanation |
Nature of the product | • Products are slightly differentiated
• Differentiation allows firms to attract customers with varying preferences |
Degree of efficiency | • Competition incentivizes firms to improve efficiency
• Achieves allocative efficiency in the long run |
Customer loyalty | • Relatively low due to availability of substitutes
• However, some loyalty may exist based on individual relationships or service quality |
Type of profit | • Abnormal profits possible in the short run
• Long-run profits tend to be normal (break-even) |
Price taker or maker? | • Firms have some price-setting ability due to product differentiation |
Level of market power | • Low degree of market power compared to monopolies |
Barriers to entry | • Low barriers to entry and exit
• Ease of entry encourages competition |
Slope of the demand curve | Shallow (elastic) compared to monopoly |
Number of firms | • Large number of small firms
• Each firm can act independently in the market |
Comparison of Monopolistic Competition, Perfect Competition and a Monopoly
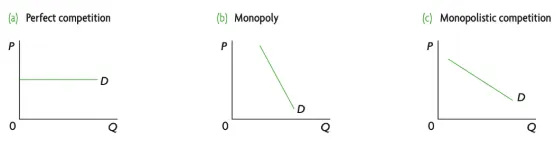
Figure 2.11.8 Demand curves facing the firm under three market structures
Diagram Analysis
•
Price competition: Firms lower prices to attract customers from competitors.
•
Non-price competition: Uses methods like product differentiation, advertising, and branding to attract customers.
•
Monopolistically competitive firms heavily invest in product differentiation, advertising, and branding to increase monopoly power.
•
Successful differentiation and branding reduce demand elasticity, giving firms more pricing control and profit potential.
•
Firms compete on both price and non-price bases, but success in non-price competition reduces reliance on price competition.
Monopolistic competitive firm
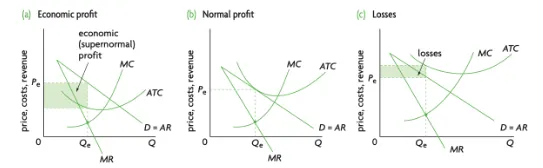
Figure 2.11.9 Short-run equilibrium positions of the firm in monopolistic competition
Abnormal Profit in Short-run
•
Firms in monopolistic competition maximises profit at MC=MR.
•
Short-run abnormal profit is possible.
•
AR curve is the firm's demand curve, downward-sloping.
•
Market power exists due to product differentiation.
•
Selling more requires a price decrease, MR falls twice as fast as AR.
Normal profit in the long run
Abnormal Profit to Normal Profit: | Losses to Normal Profit: |
• New entrants attracted by supernormal profit opportunities.
• Low barriers to entry facilitate new firms.
• Abnormal profit erodes due to increased competition.
• Long-run equilibrium: normal profit. | • Some firms shut down in response to losses.
• Low barriers to exit enable easy departure.
• Remaining firms eliminate losses.
• Long-run equilibrium: normal profit. |
Diagram analysis
•
Profit maximisation at MC=MR (Qe).
•
P1 = AC, indicating normal profit.
•
In the long run, firms achieve normal profit.
•
Loss-making firms exit, while supernormal profit diminishes with new entrants.
Losses in Short-run
•
Loss-making firms exit, causing a shift in demand to remaining firms.
•
Demand curve shifts rightward for remaining firms.
•
Process continues until losses vanish, and firms earn normal profit.
•
Long-run equilibrium: Demand curve tangent to ATC curve.
•
At MR=MC, P=ATC, and economic profit is zero.
•
Firm earns normal profit (zero economic profit).
Criticisms of the model
•
Model simplifies decisions to output and price, overlooking non-price competition.
•
Profit-maximisation in reality involves complexities beyond the model's scope.
•
Entry into industry may not be as free as assumed, granting some monopoly power.
•
Product differentiation complicates deriving an industry demand curve.
•
Monopolistic competition analysis often focuses on the individual firm level.
Efficiency in monopolistic competition
•
Monopolistic competition exhibits higher efficiency levels compared to other imperfectly competitive market structures.
•
Efficiency remains high even when firms are making abnormal profits in the short run.
•
Customers benefit from a greater variety of products and services available in the market.
•
Long-run efficiency levels in monopolistic competition are further enhanced.
Oligopolies
Oligopoly is more complex than the other market models. Therefore, there are several models of oligopolistic behaviour, which share the following characteristics:
•
Entails a small number of large firms dominating the market.
•
High barriers to entry prevent new firms from easily entering the industry.
•
Products in oligopolistic markets can be either differentiated or homogeneous.
•
Mutual interdependence characterises oligopolistic firms, where decisions made by one firm significantly affect others, leading to a keen awareness of rivals' actions.
Reasons For Collusive & Non-collusive Behaviour
Collusive Behavior:
•
Firms cooperate to fix prices and restrict output.
•
Competition diminishes as firms reduce their competitive efforts.
•
High incentive for collusion due to potential for higher profits.
Non-Collusive Behaviour:
•
Firms actively compete to maintain or increase market share.
•
Occasional price wars may occur between competitors.
•
Little to be gained as competitors can quickly match actions, resulting in minimal change in market share but significant profit loss.
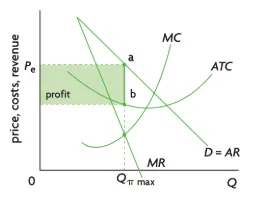
Fig 2.11.10 Collusive Oligopoly
DIagram Analysis
•
Five firms with an 80% concentration ratio collude to fix prices.
•
Acting as a single entity, they produce at the profit-maximising level where MC = MR (Qmax).
•
At this output level, AR (P1) > AC (C1), resulting in abnormal profit.
•
The collusive oligopoly achieves higher levels of abnormal profit through coordinated pricing.
Reasons for Collusion
•
Few competitors: Facilitates understanding or collaboration on pricing and output.
•
Similar costs: Uniform cost structures due to economies of scale.
•
Similar revenue: Prices remain stable as competitors react to maintain market share.
•
High barriers to entry: Discourages new entrants from challenging established firms.
•
Ineffective regulation: Allows firms to collude with minimal consequences.
•
Brand loyalty: Established market share reduces incentive for consumers to switch brands.
Types of Collusion
•
Collusion: Firms act like a monopoly, restricting competition and raising prices.
•
Overt collusion: Explicit agreements to limit competition or raise prices, often through cartels.
◦
Consequences: Higher prices, reduced output, poorer quality, less innovation.
◦
Methods: Price fixing, output quotas, blocking new entrants, monopsony power.
•
Tacit collusion: Informal monitoring and imitation of each other's behaviour.
◦
Common form: Price leadership, where firms adjust prices to match the industry leader.
◦
Difficult to detect: Regulators struggle to prove collusion.
◦
Effects: Similar benefits and consequences as overt collusion, but to a lesser extent.
Game Theory - Interdependence Between Oligopoly Firms
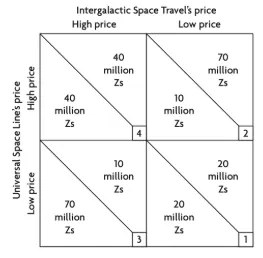
Fig 2.11.11 Game theory: The prisoner’s dilema
•
The prisoner's dilemma is a classic game in game theory, showing how rational decision-makers may end up worse off when pursuing individual interests.
•
In the example of two firms in the space travel industry, each must choose between high and low pricing strategies, resulting in different profit outcomes.
•
The firms face a dilemma where cooperation (adopting high prices) would lead to higher profits collectively, but there's an incentive to defect (adopting low prices) individually.
•
The Nash equilibrium occurs when both firms defect, resulting in the lowest possible payoff for both.
Types of Non-price Competition
•
Loyalty cards & rewards
•
Branding
•
Packaging
•
Celebrity/influencer endorsement
•
Corporate sponsorship e.g. Nike sponsoring Rafael Nadal
•
After sales service
•
Delivery policies
•
Product warranties
Market Power & Government Intervention
Advantages Created by Market Power
•
Higher Profits
◦
Firms with market power can set prices above marginal costs, leading to abnormal profits.
◦
Abnormal profits enhance the firm's reputation among shareholders and facilitate easier access to finance.
•
Research, Development & Innovation
◦
Higher profits enable investment in research, development, innovation, and expansion.
◦
This investment can result in improved product quality for consumers.
•
Economies of Scale
◦
Larger firms leverage economies of scale to reduce average costs.
◦
Lower costs allow firms to maintain price levels for higher profits or lower prices for customers.
•
Branding and Reputation
◦
Market power allows firms to establish strong brands and reputations.
◦
Brand loyalty and trust are cultivated, enabling firms to command premium prices.
•
Strategic Decision-Making
◦
Firms with market power have strategic flexibility.
◦
They can pursue long-term goals, engage in mergers, acquisitions, vertical integration, and explore new markets, leading to increased dominance and profitability.
Disadvantages Created by Market Power
•
Reduced Competition
◦
Firms with significant market power may limit new competitors or engage in anti-competitive practices.
◦
This can result in higher prices, reduced consumer choice, and decreased market efficiency.
•
Lack of Innovation & Efficiency
◦
Without competition, firms may lack motivation to improve products, lower costs, or invest in research and development.
◦
Consumer welfare and industry progress may suffer as a result.
•
Regulatory & Legal Risks
◦
Firms with significant market power face increased scrutiny and regulation.
◦
Legal actions, fines, or forced divestitures may occur if market power is deemed anti-competitive.
The use of Government Ownership to Reduce Market Power
Nationalisation can occur if the government chooses to nationalise industries that are considered strategically important for national security. Also to ensure the provision of essential services to the public such as health care or education.
The Advantages & Disadvantages of Nationalisation
Disadvantages | Disadvantages |
• Generates efficiencies, especially in delivering utilities.
• Promotes equity by ensuring equal access to resources at the same price.
• Generates significant revenue for the government. | • Government firms can run inefficiently.
• Requires significant financial resources, with associated opportunity costs.
• Government may lack expertise to run the business effectively. |
The use of Fines to Reduce Market Power
Disadvantages | Disadvantages |
• Corrects anti-competitive behaviour.
• Generates additional revenue for the government to redistribute. | • Monopoly firms may use their high profits to take legal action against regulators.
• Legal proceedings can be lengthy.
• Firms may settle out of court and pay reduced fines.
• Fines may not deter behaviour if they are less than the profit gained from anti-competitive actions. |
Price discrimination
•
Price Discrimination:
◦
Charging different prices for the same product to different consumers.
◦
Occurs when a firm has some degree of market power, facing a downward-sloping demand curve.
◦
Practised in all market structures except perfect competition.
•
Examples of Price Discrimination:
◦
Natural monopolies (electricity, gas, water companies) adjust prices based on consumption patterns.
◦
Oligopolistic firms (airlines) charge higher fares during peak seasons.
◦
Firms in monopolistic competition (cinemas, restaurants) offer discounts based on customer groups or times.
•
Consumer Separation:
◦
Consumers are divided based on characteristics such as time, geography, age, etc.
◦
Prices are differentiated accordingly to prevent resale at higher prices.
•
Different Price Elasticities of Demand (PEDs):
◦
Consumers have varying PEDs for the same product.
◦
Consumers with lower PEDs are willing to pay higher prices, enabling price discrimination.
Important diagrams to remember
The theory of the firm I: Production, costs, revenues and profit (HL)
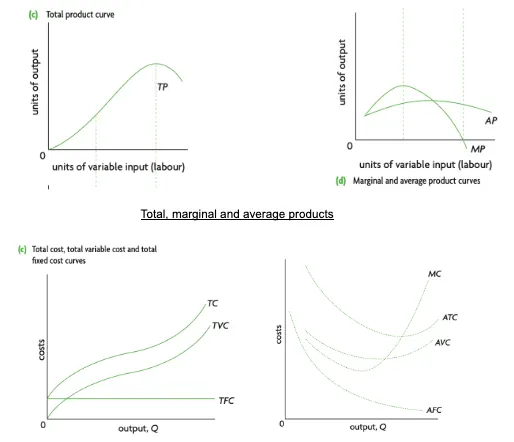
Total, average and marginal cost curves
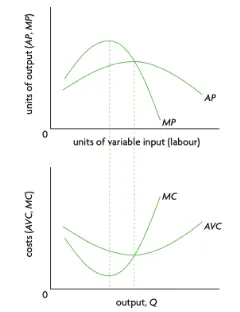
Product curves and cost curves are mirror images due to the law of diminishing returns
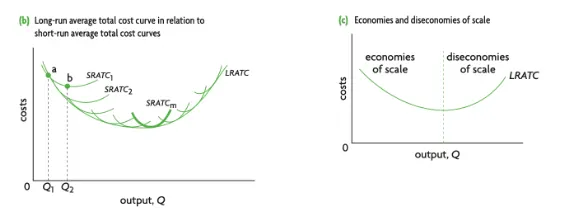
The long-run average total cost curve
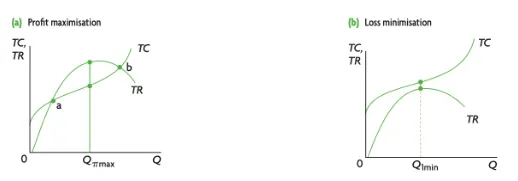
Profit maximisation using the total revenue and total cost approach when the firm has control over price
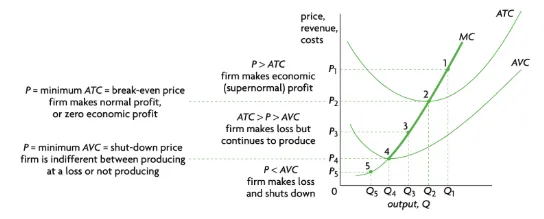
Summary of the perfectly competitive firm’s short-run decisions, and the firm’s short-run supply curve