

•
Demand: Is the amount of a good/service that a consumer is willing and able to purchase at a given price in a given time period.
•
Market demand: the sum of all individual buyers’ demand for a good.
The Law of Demand – the relationship between price and quantity demanded
The law of demand states that there is an inverse relationship between price and quantity demanded (QD), ceteris paribus
•
When the price ↑ the QD ↓
•
When the price ↓ the QD ↑
•
This is because as the P of a good increases, consumers are less willing and able to pay for the good.
Demand curve
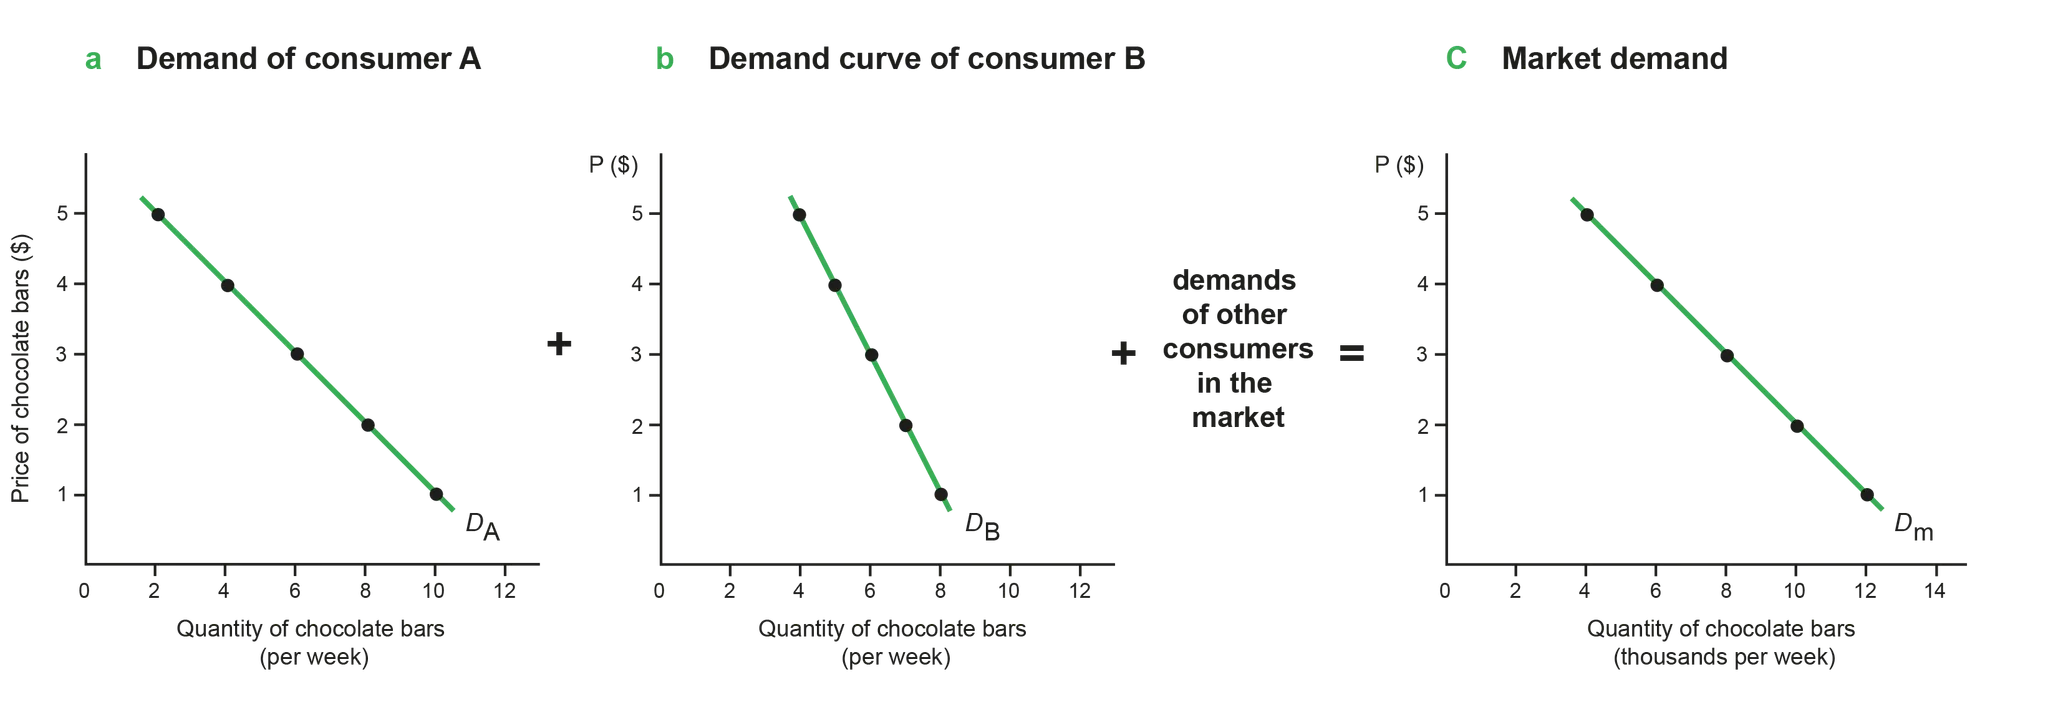
Figure 2.1.1 Market demand as the sum of individual demands
•
In a market of two buyers, market demand = individual D of buyer 1 + individual D of buyer 2.
•
The DS curve is downward sloping due to the law of demand (as P increases, Qds decreases).
Movement along a demand curve

Figure 2.1.2 Movement along and shifts of the demand curve
•
Only caused by a change in P of the good (ceteris paribus).
•
According to the law of demand, if P decreases, Qd increases = downward movement from A to B.
•
The change in Q due to change in P is called a change in Qd.
Shifts of the demand curve
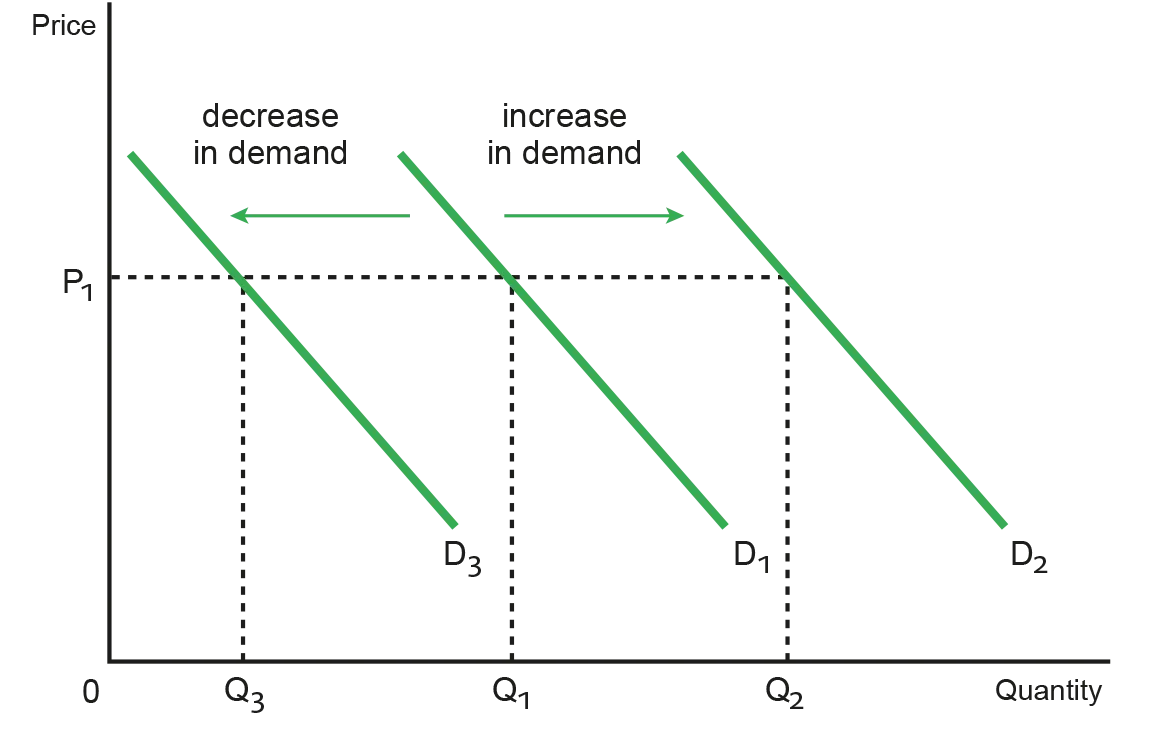
Figure 2.1.3 Movement along and shifts of the demand curve
•
Only caused by a change in non-price determinants of demand.
•
Rightward shift = increase in D, Leftward shift = decrease in D.
•
The change in Q due to the shifts in D is called a change in demand.
Non-price determinants of demand
1.
Change in income
•
Real income: Dictates consumers’ ability to enjoy goods/services
•
Direct relationship between income and demand
•
Normal goods: Clothing, Restaurant meals, Electronic Device
◦
Income ↑ = QD ↑ = D shifts right (D1→D2).
◦
Income ↓ = QD ↓ = D shifts left (D1→D3).
•
Inferior goods: Used goods, Generic Brands, Public Transportation
◦
Income ↓ = QD ↑= D shifts right (D1→D2).
◦
Income ↑ = QD ↓ = D shifts left (D1→D3)
•
Luxury goods: Designer Clothing, High-end Vehicles, Fine Dining
•
Demand increases disproportionately with income growth, but may decrease with substantial income declines.
2.
Changes in taste and preferences
•
If goods/services become more preferable then demand for them increases
◦
Advertising or branding can change tastes/preferences
◦
Example: As vapes gained popularity, consumer preferences shifted in favour of vapes, leading to a rapid increase in demand.
3.
Prices of Substitute goods
•
Substitutes: goods that satisfy a similar need (e.g. Pepsi and Sprite).
•
Price of good A ↑ = QD of good B ↑ = D of good B shifts right, D of good A shifts left
•
Price of good A ↓ = QD of good B ↓ = D of good B shifts left, D of good A shifts right
◦
This is because consumers of Sprite shift from Sprite to Pepsi
4.
Prices of Complementary goods
•
Complementary goods are used together (e.g., computer and software).
•
Price of good A ↑ = QD of good B ↓ = both good QD shifts left
•
Price of good A ↓ = QD of good B ↑ = both good QD shifts right
◦
This is because the fall in P of computers results in a bigger quantity of computers being purchased =, so D for computer software increases.
5.
Change in numbers of consumers (demographic)
•
Increase in the number of buyers raises demand; decrease in buyers lowers demand.
6.
Future price expectations
•
If consumers anticipate a future price increase:
◦
They will purchase the good/service now = QD ↑
•
If consumers anticipate a future price decrease:
◦
Delay their purchase = QD ↓
Assumptions underlying the Law of Demand (HL only)
1.
The income Effect
•
Refers to the change in consumer’s purchasing power
•
Price of a good ↓ = consumers' purchasing power ↑ =consumers can buy more with the same income.
•
Price of a good ↑ = consumers' purchasing power ↓ = consumers can afford to purchase less with the same income.
•
Assumes consumers adjust consumption patterns based on changes in purchasing power from price fluctuations.
2.
The substitution Effect
•
Consumer replace relatively expensive goods/services with other alternatives
•
Price of a good ↑ = Consumers seek alternatives offering similar satisfaction at lower costs.
•
Assumes rational decision-making: Consumers respond to price changes by adjusting consumption based on perfect information.
3.
The Law of Diminishing Marginal Utility
•
States that as more products are consumed, the satisfaction gained from each additional unit decreases.
•
Marginal utility: Refers to the extra satisfaction obtained from consuming one more unit.
•
Diminishing utility: Initially, the first unit provides higher satisfaction compared to subsequent units.
◦
A hungry person enjoys high satisfaction from their first hamburger but gains less satisfaction from each subsequent one.
◦
Makes consuming additional units more appealing for consumers, leading to a downward movement along the demand curve = Price of the good ↓