 Understanding points
C4.1.1 Populations as interacting groups of organisms of the same species living in an area
C4.1.2 Estimation of population size by random sampling
C4.1.3 Random quadrat sampling to estimate population size for sessile organisms
C4.1.4 Capture–mark–release–recapture and the Lincoln index to estimate population size for motile organisms
C4.1.5 Carrying capacity and competition for limited resources
C4.1.6 Negative feedback control of population size by density-dependent factors
C4.1.7 Population growth curves
C4.1.8 Modelling of the sigmoid population growth curve
C4.1.9 A community as all of the interacting organisms in an ecosystem
C4.1.10 Competition versus cooperation in intraspecific relationships
C4.1.11 Herbivory, predation, interspecific competition, mutualism, parasitism and pathogenicity as categories of interspecific relationship within communities
C4.1.12 Mutualism as an interspecific relationship that benefits both species
C4.1.13 Resource competition between endemic and invasive species
C4.1.14 Tests for interspecific competition
C4.1.15 Use of the chi-squared test for association between two species
C4.1.16 Predator–prey relationships as an example of density-dependent control of animal populations
C4.1.17 Top-down and bottom-up control of populations in communities
C4.1.18 Allelopathy and secretion of antibiotics |
Population
A group of individuals of the same species living in an area
•
Carrying capacity: maximum population size that an environment can support
◦
Determined by abundance of resources: water, space, food
Estimation of population size
Random sampling
Every member of the species has an equal chance of being selected
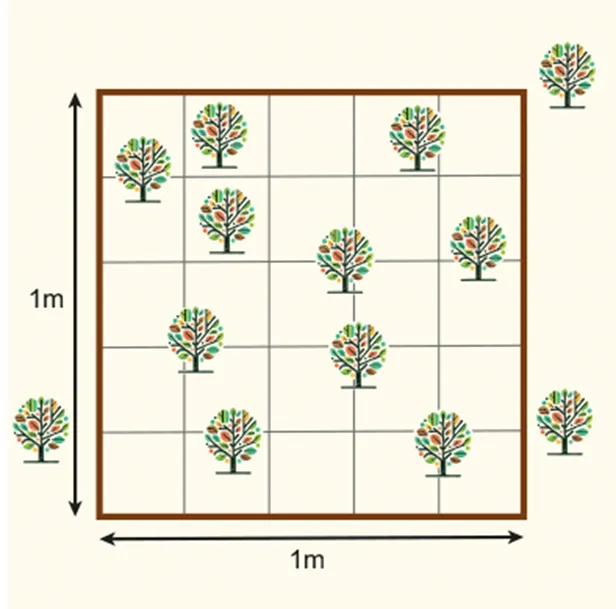
Quadrat sampling
Repeatedly placing a quadrat frame at random locations and recording the number of organisms present each time
Only suitable for organisms that do not move (sessile)
Capture-mark-release-recapture
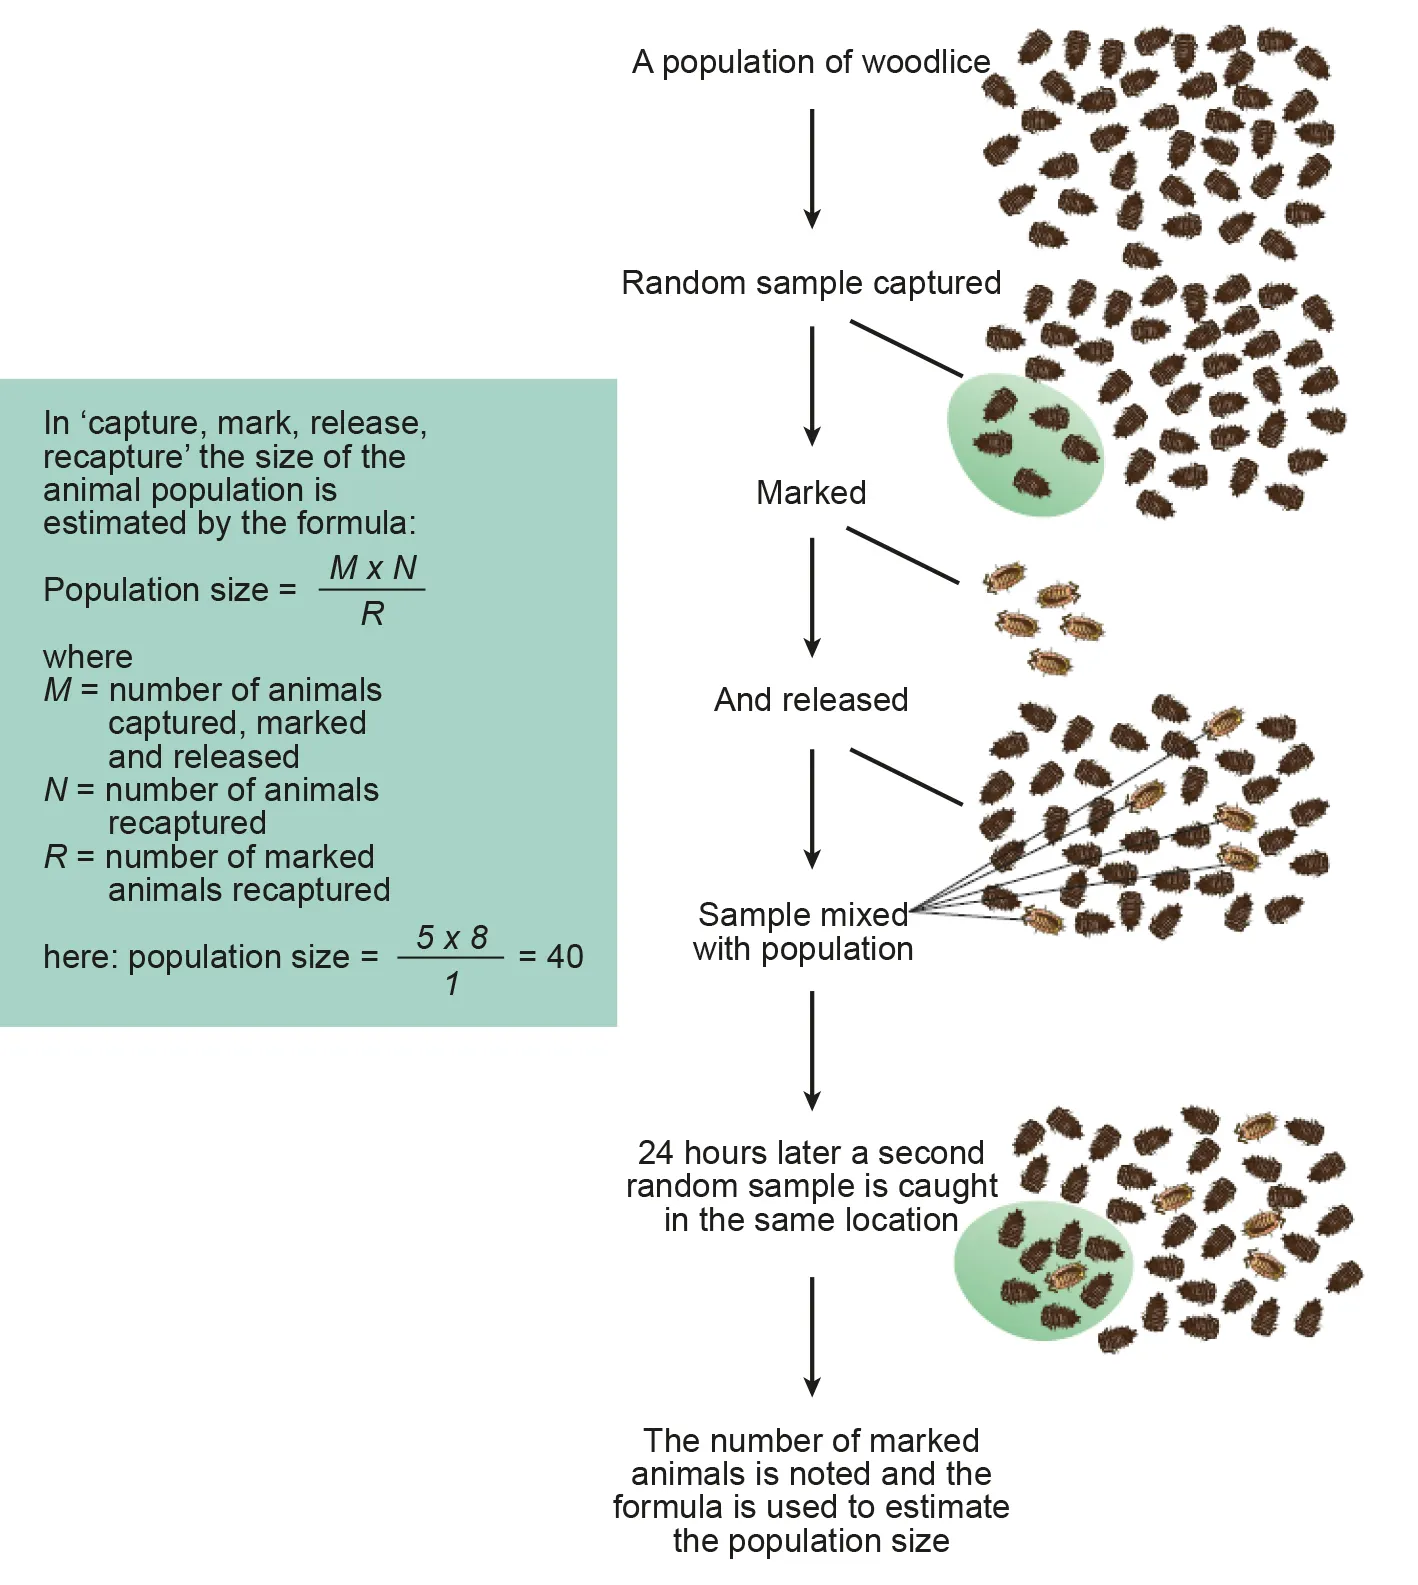
Use the Lincoln Index to estimate the population size =
(M=marked, N=captured, R=recaptured with mark)
Assumptions:
•
No births, deaths, or migration into the population
•
The mark stays visible and does not affect chance of survival
•
Marked individuals have the same chance of recapture as unmarked individuals
Control of population size
•
Density-independent factors: have the same effect regardless of population size
◦
e.g. forest fires
•
Density-dependent factors: have an increasing effect as the population grows
◦
e.g. competition, predation, infectious disease
◦
Enables negative feedback
Population growth
•
Determined by: natality, mortality, immigration, emigration
•
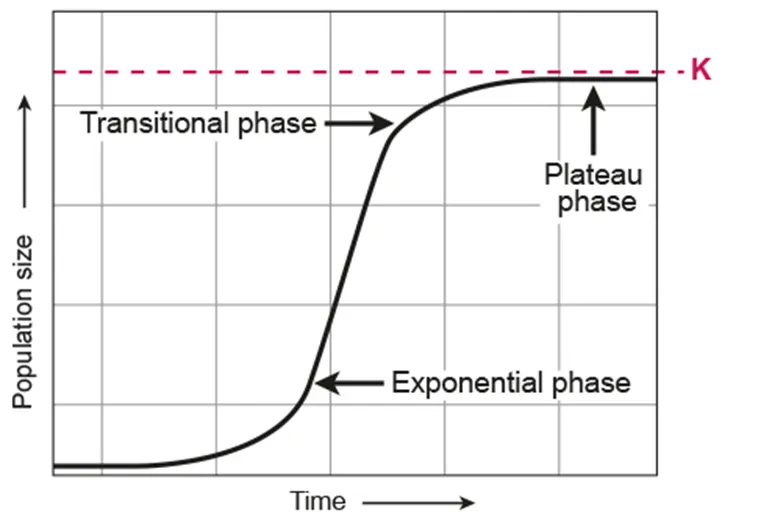
Phases of the sigmoid growth curve:
◦
Exponential: in an ideal environment with unlimited resources, the population grows more and more rapidly as there are more births than deaths
◦
Transitional: population growth slows due to limiting factors and competition
◦
Plateau: population reaches carrying capacity due to environmental resistance


Community
A group of populations living together in an area and interacting with each other
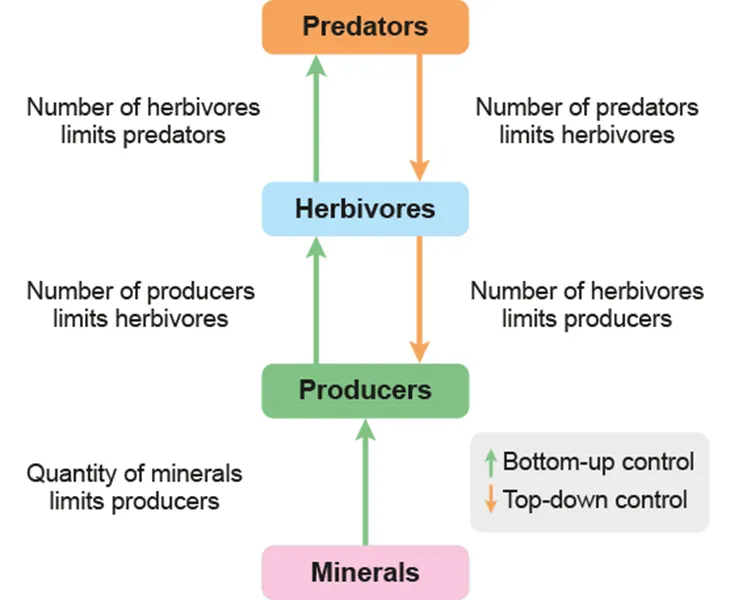
•
Top-down control: a higher trophic level acts on a lower one by predation
•
Bottom-up control: a lower trophic level acts on a higher one by resource restriction
Intraspecific relationship
Between members of the same species
•
Competition: wildebeest males fight for territory
•
Cooperation: penguins huddle together to conserve body heat
Interspecific relationship
Between different species
Herbivory | Primary consumers feed on producers
e.g. cow grazes on grass |
Predation | One consumer kills and eats another consumer
e.g. lion hunts and eats gazelle |
Competition | The amount of resources taken by one species reduces that available for another
e.g. ivy and oak |
Mutualism | Both species benefit from a close association
e.g. corals and zooxanthellae: coral gains oxygen and organic compounds, algae gains a safe environment and CO₂ for photosynthesis
e.g. legumes and Rhizobium: plant gains ammonium, bacteria gains sugars and a safe environment inside root nodules |
Pathogenicity | One species lives inside another and causes disease
e.g. bacteria in humans |
Parasitism | The parasite benefits at the expense of the host from which it obtains food
e.g. ticks on deer |


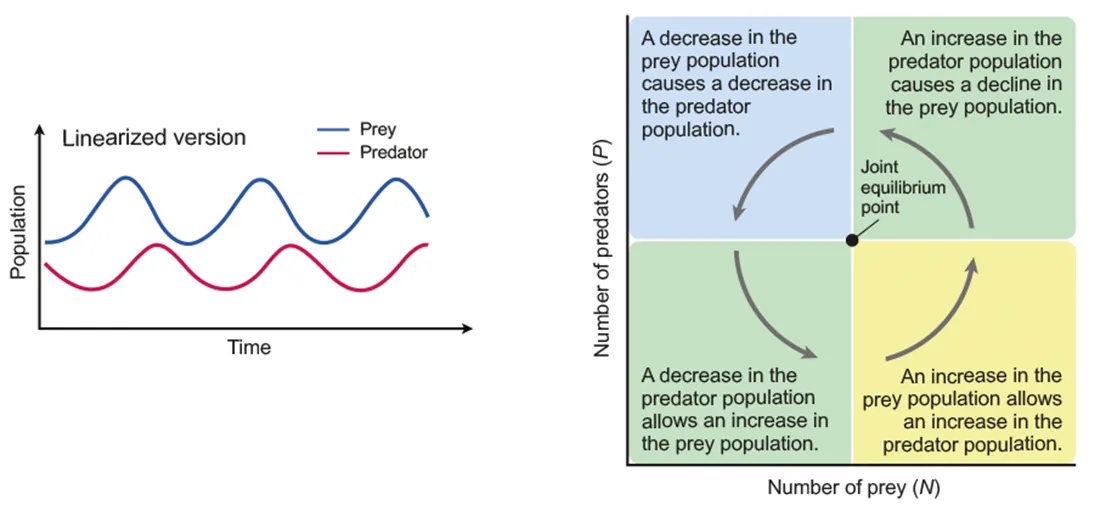
Predator-prey relationship
•
Density-dependent interactions lead to cyclic oscillations in populations


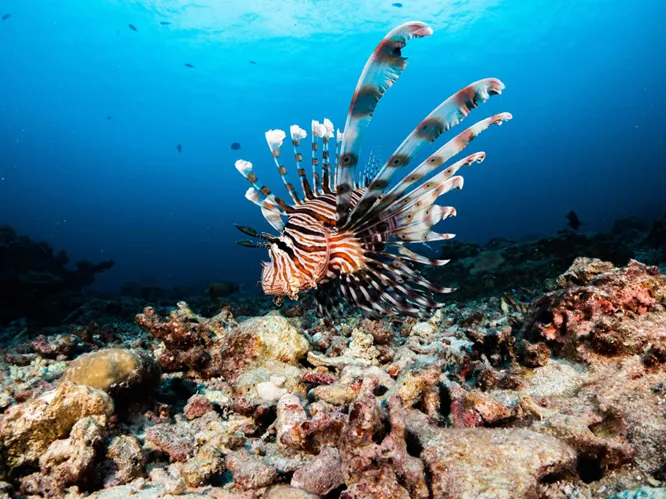
Endemic vs invasive species
•
Endemic: species that occur naturally in an area
•
Invasive: alien species that are introduced by humans and multiply quickly due to absence of pests or predators in their original habitat


Chi-squared test
1) Determine two alternative hypotheses
H₀: two species are distributed independently
H₁: two species are associated in their distribution
2) Draw a contingency table and calculate the row and column totals
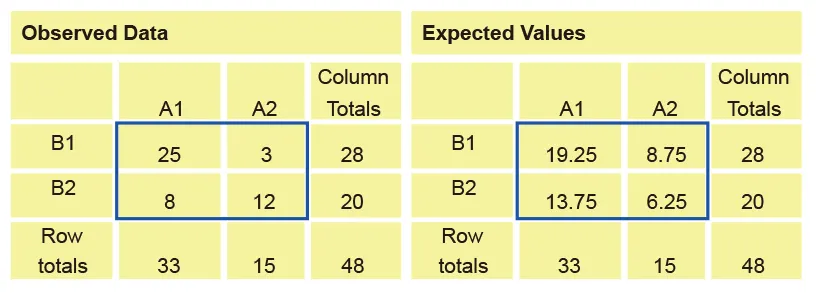
3) Calculate the expected frequency as:
4) Calculate the degrees of freedom
Degrees of freedom = (m - 1)(n - 1)
Where m, n = number of rows, columns
5) Find the critical region from a table of chi-squared values and p=0.05
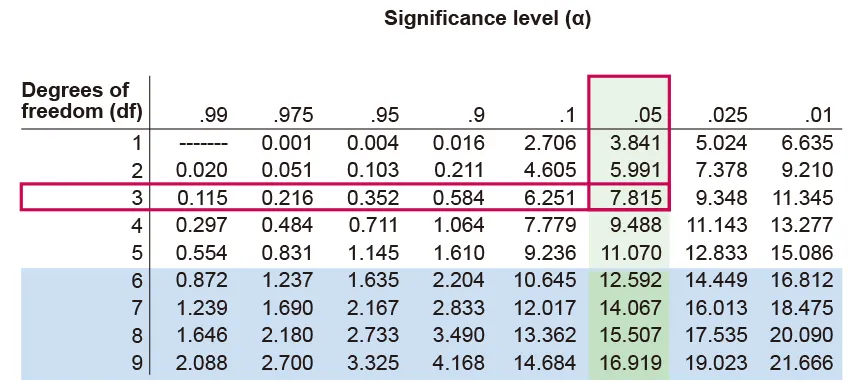
6) Calculate the chi-squared value
x² = chi squared
Oᵢ = observed value
Eᵢ = expected value
7) Accept/reject the null hypothesis
Chi-squared value < critical value
•
Accept null hypothesis
•
There is no significant association between the species - they are randomly distributed
Chi-squared value > critical value
•
Reject null hypothesis
•
There is evidence at the 5% significance level that there is an association between the species


Antibiotics and allelopathic agents
Antibiotics | Allelopathic agents |
Produced by microorganisms to kill or inhibit other microorganism species
e.g. penicillin by Penicillium species | Produced by plants to kill or inhibit the growth of neighboring plants
e.g. ailanthone by Ailanthus altissima |